. 2011 Sep 13;108(37):15414-9.
doi: 10.1073/pnas.1110854108. Epub 2011 Aug 8.

Anterograde or retrograde transsynaptic labeling of CNS neurons with vesicular stomatitis virus vectors

Affiliations

Anterograde or retrograde transsynaptic labeling of CNS neurons with vesicular stomatitis virus vectors

Kevin T Beier et al. Proc Natl Acad Sci U S A. .

Erratum in

  • Proc Natl Acad Sci U S A. 2012 Jun 5;109(23):9219

Abstract

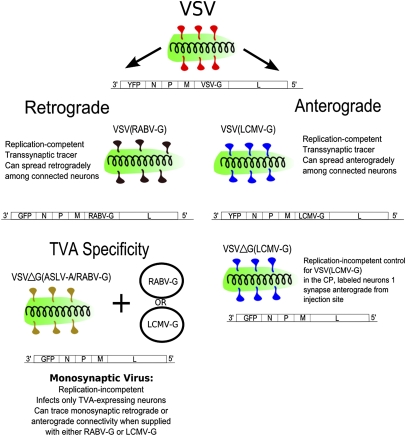
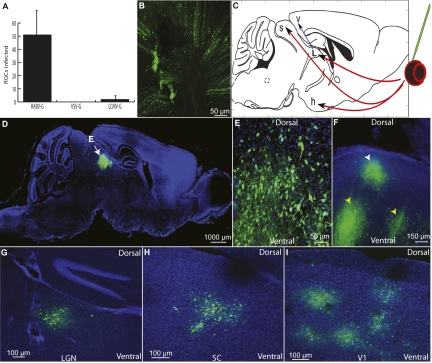
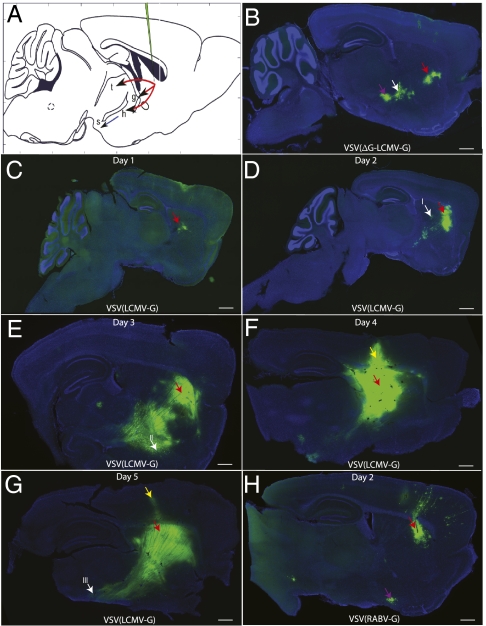
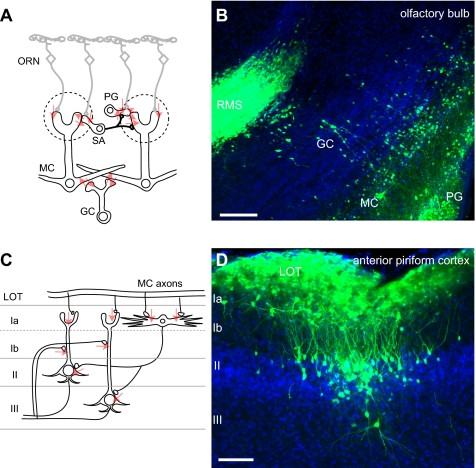
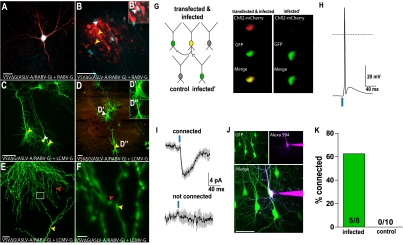
To understand how the nervous system processes information, a map of the connections among neurons would be of great benefit. Here we describe the use of vesicular stomatitis virus (VSV) for tracing neuronal connections in vivo. We made VSV vectors that used glycoprotein (G) genes from several other viruses. The G protein from lymphocytic choriomeningitis virus endowed VSV with the ability to spread transsynaptically, specifically in an anterograde direction, whereas the rabies virus glycoprotein gave a specifically retrograde transsynaptic pattern. The use of an avian G protein fusion allowed specific targeting of cells expressing an avian receptor, which allowed a demonstration of monosynaptic anterograde tracing from defined cells. Synaptic connectivity of pairs of virally labeled cells was demonstrated by using slice cultures and electrophysiology. In vivo infections of several areas in the mouse brain led to the predicted patterns of spread for anterograde or retrograde tracers.


Conflict of interest statement

The authors declare no conflict of interest.

Figures

Fig. 1.
Fig. 1.
The viruses used in this study. The glycoproteins used are diagrammed as follows: red, VSV-G; black, RABV-G; blue, LCMV-G; yellow, ASLV-A/RABV-G. The status of the G gene in the viral genome was as follows: ΔG, G gene is deleted; RABV-G and LCMV-G, G gene encoded in the viral genome (for the replication-competent viruses). The circles adjacent to VSVΔG(ASLV-A/RABV-G) indicate plasmid delivery of either RABV-G or LCMV-G for pseudotyping of the VSVΔG virus after infection of TVA-expressing cells by VSVΔG(ASLV-A/RABV-G).
Fig. 2.
Fig. 2.
Patterns of spread of VSV vectors injected into the eye and brain. (A) Retrograde transport of VSV was tested for VSV(RABV-G), WT VSV (which uses VSV-G), and VSV(LCMV-G) after injection into the LGN. The number of fluorescently labeled RGCs per retina at 4 dpi was counted (n = 4 animals for each virus). (Error bars: 1 SD.) (B) Anterograde transmission was tested by injection into the vitreous body of the eye. To determine whether RGCs were infected, RGC axons were examined and found to be fluorescently labeled after viral injection, as shown by an image taken at the optic nerve head of a VSV(LCMV-G)-infected retina 4 dpi. (C) An anterograde transsynaptic virus injected into the retina would be expected to label several brain centers involved in visual processing by anterograde spread, including the hypothalamus (h), LGN (L), SC (s), and V1 (v). Red arrows show direct targets of RGCs; blue indicates an indirect target; green indicates the injection site. (DF) Parasaggital sections from brains after VSV(LCMV-G) injection into the eye. (D and E) In all mice injected in the eye subretinally, labeling in the brain was restricted to the visual system. At 7 dpi, strong labeling was observed in the deep layers of the SC (white arrow in D; high magnification shown in E). (F) A parasaggital section of the SC showing labeling in the more superficial layers (white arrowhead) and in the deeper layers (yellow arrowheads) at 6 dpi. Labeling was seen initially in the more superficial layers at 3 dpi and then in deeper layers at later times. (GI) Primary retinorecipient areas (LGN, SC, SCN) and secondary (V1) visual centers were labeled after infection of the eye by VSV(LCMV-G), but not by the other viruses. Labeled nuclei 4 dpi included the LGN (G), SC (H), and V1 (I). (Images are from the same brain.) C is adapted from Franklin & Paxinos (56).
Fig. 3.
Fig. 3.
Pattern of spread of VSV using LCMV-G and RABV-G after injection into the CP. (A) Expected targets for anterograde spread include the thalamus (t), GP (g), STn (h), and SNr (s) (red arrows, primary anterograde transsynaptic spread; blue, secondary anterograde spread; green, injection site). (B) Some of the direct anterograde targets were labeled with the replication-incompetent form, VSVΔG(LCMV-G), 4 dpi, including the GP (white arrow) and STn (purple arrow). (CG) Replication-competent VSV(LCMV-G) was injected into the CP, and the time course of labeling was monitored for 5 d (C, 1 dpi; D, 2 dpi; E, 3 dpi; F, 4 dpi; G, 5 dpi). (H) The pattern of anterograde viral spread was distinct from that of retrograde spread, which was demonstrated by injection of VSV(RABV-G) into the CP, with the results shown at 2 dpi. The cortex exhibited many fluorescently labeled neurons, as did the nucleus basalis (purple arrow), which projects to the cortex, but not the CP. White arrows in D, E, and G, areas of high-magnification images (Fig. S2); red arrows, injection site; yellow arrows, leakage of virus along the needle path in F and G. (Scale bars: 1 mm.) A is adapted from Franklin & Paxinos (56).
Fig. 4.
Fig. 4.
Labeling of the olfactory system with VSV(LCMV-G). (A) Connection diagram (red arrows) from the peripheral ORNs, which were infected in the nose, to the neurons in the OB. SA, short axon cells, MC, mitral cells, GC, granule cells. (B) OB at 3 dpi showed labeled PG, MC, GC, and the rostral migratory stream (RMS). (C) A connection diagram (red arrows) from the MC axons in the lateral olfactory tract (LOT) to the neurons in the olfactory cortex. Layer Ia neurons are primarily GABAergic local inhibitory neurons, and II/III pyramidal cells receive direct input from MC axons, in addition to feedforward inhibition from layer I inhibitor neurons. (D) Labeled layer I inhibitory neurons and layer II/III pyramidal cells at 5 dpi in the anterior piriform cortex. (Scale bars: 100 μm.)
Fig. 5.
Fig. 5.
Recombinant VSV vectors can be used for monosynaptic tracing. Cultured hippocampal slices were used to test for monosynaptic transmission of replication-incompetent VSV after specific infection of TVA-expressing neurons. A gene gun was used to deliver plasmids, as indicated, to test for infectivity of virions pseudotyped by the fusion protein, ASLV-A/RABV-G, as well as transmission using either RABV-G or LCMV-G. (A and B) Transfected plasmids encoded TVA, CFP (blue, as a transfection marker), and RABV-G. Infection with VSVΔG encoding mCherry pseudotyped with ASLV-A/RABV-G 18 hpi resulted in many more infection events, relative to those seen without TVA. (A) An infected (mCherry+) and transfected (CFP+) cell. (B) Spread was seen from cells that were both transfected (CFP+) and infected (mCherry+) (white arrowhead) to many cells adjacent to the cell bodies and dendrites (yellow arrowheads) of the transfected cells by 18 hpi. (B') The cell with the white arrowhead in B was expressing mCherry. (CF) Transfected plasmids encoded TVA, LCMV-G, and ChR2-mCherry. Infection was with VSVΔG encoding GFP. (C and D) Transfected/infected cells (mCherry+/GFP+, white arrowhead) were observed with infection of nearby nontransfected cells (mCherry/GFP+, yellow arrowheads). These secondarily infected cells extended dendritic processes to the axon terminals of transfected/ infected cells. Insets in D show colabel of the mCherry and GFP in the upstream (D’), but not downstream (D’’) neuron. Note that there are relatively fewer clusters of infected cells near the cell body and dendrites of transfected+/infected+ pyramidal cells (D) compared with the clusters seen after introduction of RABV-G into pyramidal cells, shown in B. (E and F) Juxtaposition of processes of transfected+/infected+ (red arrowhead) and transfected/infected+ cells (yellow arrowhead). (F) High magnification of boxed area in E. (GK) Patch clamp recordings were obtained from infected (transfected/infected+) and control (transfected/infected) neurons clustered around upstream (transfected+/infected+) neurons. Upstream neurons were optically activated with pulses of blue light. (G) Diagram of recording configuration (Left) and images of the schematized upstream and infected cells taken through a camera mounted on the physiology microscope (Right). (H) Current clamp recordings made from upstream neurons demonstrate that a 2-ms pulse of 20-mW, 473-nm light was sufficient to fire an action potential. (I) Example voltage clamp (Vm = −70 mV) from two neurons with (infected) and without (not infected) a synaptic connection to the upstream neuron. Connected cells were identified by inward currents that were reliably evoked and time locked to the optical stimulus. (J) Recorded neurons were filled with dye through the patch electrode, and two photon stacks were used to image and confirm the cell’s infection status. Example shown was the downstream connected cell in I. (K) Summary graph showing the percent of connected infected and control (uninfected) neurons. Multiple infected and uninfected cells were recorded from each cluster (six clusters total). (Scale bars: AD, J, 100 μm; E, 20 μm; F, 2.5 μm.)

Comment in

  • Neural circuits look forward.
    Tuncdemir SN, Fishell G. Tuncdemir SN, et al. Proc Natl Acad Sci U S A. 2011 Sep 27;108(39):16137-8. doi: 10.1073/pnas.1112842108. Epub 2011 Sep 13. Proc Natl Acad Sci U S A. 2011. PMID: 21914847 Free PMC article. No abstract available.

Similar articles

Cited by

References

    1. Enquist L-W, Card J-P. Recent advances in the use of neurotropic viruses for circuit analysis. Curr Opin Neurobiol. 2003;13:603–606. - PubMed
    1. Kelly R-M, Strick P-L. Rabies as a transneuronal tracer of circuits in the central nervous system. J Neurosci Methods. 2000;103:63–71. - PubMed
    1. Enquist L-W. Exploiting circuit-specific spread of pseudorabies virus in the central nervous system: Insights to pathogenesis and circuit tracers. J Infect Dis. 2002;186(Suppl 2):S209–S214. - PubMed
    1. Sun X, Belouzard S, Whittaker G-R. Molecular architecture of the bipartite fusion loops of vesicular stomatitis virus glycoprotein G, a class III viral fusion protein. J Biol Chem. 2008;283:6418–6427. - PubMed
    1. Mebatsion T, Konig M, Conzelmann K-K. Budding of rabies virus particles in the absence of the spike glycoprotein. Cell. 1996;84:941–951. - PubMed

Publication types

LinkOut - more resources