. 2012 Feb;22(2):305-20.
doi: 10.1038/cr.2011.128. Epub 2011 Aug 9.

The MRE11 GAR motif regulates DNA double-strand break processing and ATR activation

Affiliations

The MRE11 GAR motif regulates DNA double-strand break processing and ATR activation

Zhenbao Yu et al. Cell Res. 2012 Feb.

Abstract

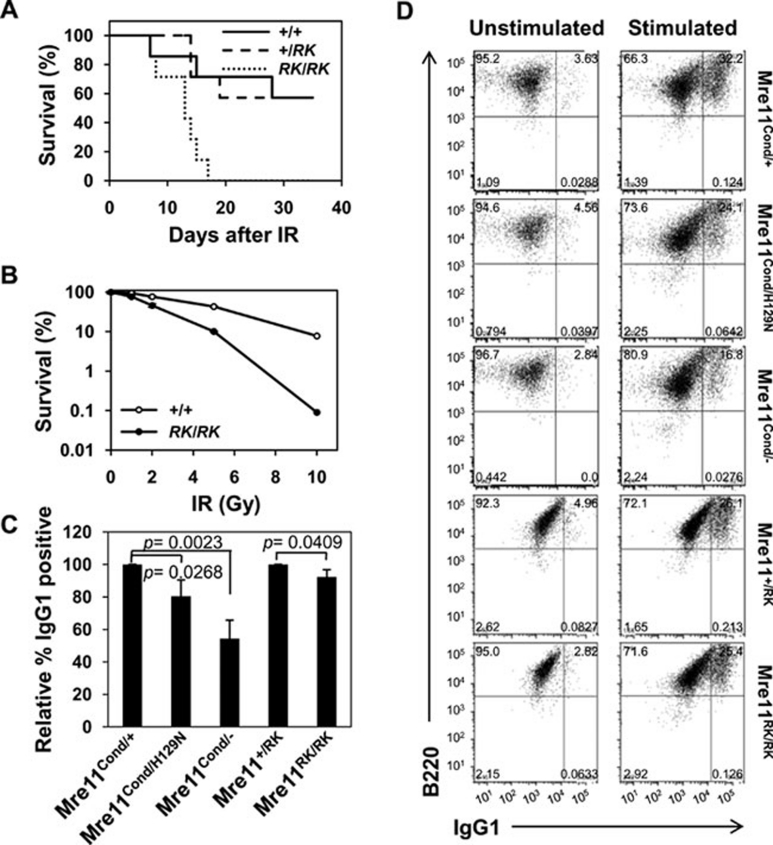
The MRE11/RAD50/NBS1 complex is the primary sensor rapidly recruited to DNA double-strand breaks (DSBs). MRE11 is known to be arginine methylated by PRMT1 within its glycine-arginine-rich (GAR) motif. In this study, we report a mouse knock-in allele of Mre11 that substitutes the arginines with lysines in the GAR motif and generates the MRE11(RK) protein devoid of methylated arginines. The Mre11(RK/RK) mice were hypersensitive to γ-irradiation (IR) and the cells from these mice displayed cell cycle checkpoint defects and chromosome instability. Moreover, the Mre11(RK/RK) MEFs exhibited ATR/CHK1 signaling defects and impairment in the recruitment of RPA and RAD51 to the damaged sites. The M(RK)RN complex formed and localized to the sites of DNA damage and normally activated the ATM pathway in response to IR. The M(RK)RN complex exhibited exonuclease and DNA-binding defects in vitro responsible for the impaired DNA end resection and ATR activation observed in vivo in response to IR. Our findings provide genetic evidence for the critical role of the MRE11 GAR motif in DSB repair, and demonstrate a mechanistic link between post-translational modifications at the MRE11 GAR motif and DSB processing, as well as the ATR/CHK1 checkpoint signaling.


Figures

Figure 1
Figure 1
Generation of Mre11RK/RK mice and MEF cells. (A) Schematic representation of the wild-type MRE11 with the glycine-arginine rich (GAR) motif and the sequence of MRE11RK substituting the arginine with lysine residues. (B) Schematic representation of the mouse Mre11 allele and Mre11RK allele. The initial strategy (MRE11RKNeo) shows the targeting position at the exon 14, with substitution of arginine with lysine residues as shown in A and the targeting plasmid structural elements. Shown in Mre11RK is the targeted locus with deletion of Neo. The exons are the black boxes and the line represents introns not drawn to scale. The white and blank triangles denote loxP sites and FRT sites, respectively, and the small arrows denote the primers used for PCR analysis. The expected size of the PCR DNA fragment amplified by the primer pair of primer 3 and primer 6 for the wild-type allele is 525 bp, while the size of the DNA fragment for the Mre11RK allele is 591 bp. (C) Genomic DNA isolated from primary MEFs was analyzed by PCR using the primer pair of primer 3 and primer 6 as indicated in B and the DNA fragments visualized on an ethidium-bromide-stained agarose gel. M denotes molecular mass markers of the 1 kb ladder (Invitrogen). (D) Total cellular RNA was isolated from primary MEFs and subjected to reverse transcription-PCR. The DNA fragment was purified and digested with EcoRI and then separated on an agarose gel. M denotes molecular mass markers of the 1 kb ladder (Invitrogen).
Figure 2
Figure 2
Mre11RK/RK mice and MEFs are hypersensitive to IR, but the B lymphocytes have no significant impact on class switching recombination. (A) Mre11+/+, Mre11+/RK and Mre11RK/RK mice were treated with 10 Gy IR and monitored for signs of radiation toxicity over 35 days. Mre11RK/RK mice showed a significant reduction in survival rates compared to Mre11+/+ and Mre11+/RK mice according to the log-rank test (P = 0.0066). The percentage survival was plotted as a function of days post IR. (B) Approximately 200-400 immortalized MEFs were seeded on a 10 cm tissue culture dish and treated with various doses of IR. The cells were then maintained in regular medium. Fourteen to twenty days later, the cells were fixed and cell colonies were stained with crystal violet and counted. The colony number was normalized to percentage of untreated cells and plotted as a function of IR dosage. The graphs shown represent the average and standard deviation (SD) from four independent immortalized MEF cell lines (clones) of each genotype. The asterisks denotes P < 0.01 using the Student's t-test. (C) Flow cytometric analysis of immunoglobulin class switching from IgM to IgG in B lymphocytes cultured with IL-4 and anti-CD40 for four days. Bar graph depicts comparisons of IgG1+ cell populations relative to Mre11+/cond control, from an average (+SD) of three mice per genotype. Mre11cond is Mre11Δ in B lymphocytes. (D) Flow cytometric analysis of immunoglobulin class switching from IgM to IgG in B lymphocytes cultured with IL-4 and anti-CD40 for 4 days shown in panel C.
Figure 3
Figure 3
Chromosomal instability and DNA damage checkpoint defect in Mre11RK/RK MEFs. (A) Representative metaphases from IR-treated passage 2 Mre11RK/RK MEF cells (left) and untreated passage 7 Mre11RK/RK MEF cells (right). Breaks were indicated by arrows and radial chromosomes were cycled. (B) Chromosome breakage analysis of IR-treated passage 2 wild-type and Mre11RK/RK MEFs. The metaphases were grouped into four categories according to the number of chromosome aberrations per metaphase observed and the percentage of the metaphases in each group was calculated (left). The data were also expressed by average aberrations per metaphase at both 2N phase and 4N phase, respectively (right). Statistical significance was assessed using Student's t-test. *(RK/RK versus +/+; 2N) P < 0.05 and **(RK/RK versus +/+; 4N) P < 0.001. (C) Chromosome breakage analysis of untreated passage 7 wild-type and Mre11RK/RK MEFs. The result was presented as that in B. Statistical significance was assessed using Student's t-test. **(RK/RK versus +/+; 2N or 4N) P < 0.001. (D) G2/M checkpoint analysis. Mre11+/+, Mre11+/RK and Mre11RK/RK MEFs were left untreated or treated with 5 or 10 Gy of IR. At 1.5 h after treatment, the cells were fixed and stained with propidium iodide and anti-pS10-histone H3 antibody to identify the cells in mitosis. The percentage of pS10-histone H3-positive cells was determined by flow cytometry and expressed as a ratio of IR treated to non-IR treated. The experiments were performed more than three times for each dosage. Statistical significance was assessed using Student's t-test. *(RK/RK versus +/+ or +/RK; 5 Gy) P < 0.01 and **(RK/RK versus +/+ or +/RK; 10 Gy) P < 0.001.
Figure 4
Figure 4
MRN complex formation, localization to sites of DNA damage and IR-induced ATM activation are normal in Mre11RK/RK MEFs. (A) Whole-cell lysates from wild-type and Mre11RK/RKMEFs, respectively, were immunoprecipitated with anti-MRE11 antibody. The bound proteins were separated by SDS-PAGE and immunoblotted with indicated antibodies. (B) Mre11+/+ and Mre11RK/RK MEFs were treated with 10 Gy of IR or left untreated. Two hours later, the cells were visualized by indirect immunofluorescence with anti-MRE11 antibody. The scale bar represents 10 μm. (C) Mre11+/+ and Mre11RK/RK MEFs were treated with 10 Gy of IR or left untreated (−). The cells were harvested at the indicated times after IR treatment. Total cellular proteins were subjected to immunoblotting with anti-ATMpS1981, anti-γH2AX and anti-CHK2 antibodies.
Figure 5
Figure 5
IR-induced nuclear foci of γH2AX and 53BP1 are normal in Mre11RK/RK MEFs. Wild-type (Mre11+/+) and Mre11RK/RK MEF cells, respectively, were left untreated or treated with 10 Gy of IR. After 2 h of recovery, the cells were visualized by indirect immunofluorescence with anti-γH2AX and anti-53BP1 antibodies, respectively. Cells with > 5 foci were counted and expressed as a percentage. The graphs show the average and standard error of the mean from two independent experiments performed in duplicates, where > 20 different fields were analyzed. In total more than 500 cells were counted for each sample in each experiment. The scale bar represents 10 μm.
Figure 6
Figure 6
IR-induced CHK1 phosphorylation and activation are defective in Mre11RK/RK MEFs. (A) Mre11+/+ and Mre11RK/RK MEFs were treated with 10 Gy of IR or left untreated (−). The cells were harvested at the indicated times after IR treatment. Total cellular proteins were subjected to immunoblotting with the indicated antibodies. (B) Mre11+/+ and Mre11RK/RK MEFs were treated with 10 Gy of IR or left untreated (−). The cells were harvested at the indicated times after IR treatment, and whole-cell lysates were subjected to immunoprecipitation with the anti-CHK1 antibody. The bound proteins were used for CHK1 activity assay as described in Materials and Methods. (C) MEFs were treated as in A. The cells were harvested at the indicated times after IR treatment. Total cellular proteins were subjected to immunoblotting with the anti-CDC25A and anti-α-tubulin antibodies as a loading control. (D) MEFs were infected with the empty retroviral vector pMSCV-puro (Vector) or the vector which expresses wild-type human MRE11 (WT) or MRE11 RK mutant (RK). The infected cells were selected with 2 μg/ml of puromycin for 2 days after infection. The cells were then treated with 10 Gy of IR (+) or left untreated (−). The cells were harvested at 15 min after IR treatment. Total cellular proteins were subjected to immunoblotting with the indicated antibodies.
Figure 7
Figure 7
Defect in exonuclease activity and DNA binding of MRKRN complex. (A) SDS-PAGE of purified wild-type MRN (WT) and MRKRN (RK). (B) Exonuclease assays of MRN (2.5-15 nM) and MRKRN (2.5-15 nM) on dsDNA. The concentration of protein is calculated in function of MRE11. (C) Competition electrophoretic mobility shift assays were performed with MRN or MRKRN and ssDNA (SS), dsDNA (DS) and splayed arm (SA) substrates. The concentration of protein is calculated in function of MRE11. (D) Quantification of the DNA binding of panel C.
Figure 8
Figure 8
Mre11RK/RK MEFs have defects in IR-induced RPA2 and RAD51 foci formation. Mre11+/+ and Mre11RK/RK MEFs, respectively, were left untreated or treated with 10 Gy of IR. After varying hours of recovery, the cells were visualized by indirect immunofluorescence with anti-RPA2 or anti-RAD51 antibody. (A) A typical image was shown for each sample. (B) The cells with > 5 foci were counted and expressed as a percentage. The graph shows the average and standard error of the mean (SEM) from two independent experiments performed in duplicates, where > 20 different fields were analyzed. In total, more than 500 cells were counted for each sample in each experiment. Statistical significance was assessed using Student's t-test. *P < 0.05 and **P < 0.001. (C) The number of foci in the cells with > 5 RPA2 foci was counted. The graph shows the average number of foci in each cell, which has > 5 RPA2 foci and SEM from two independent experiments performed in duplicates. In total, more than 40 cells were counted for each sample. Statistical significance was assessed using Student's t-test. *P < 0.01 and **P < 0.001.
Figure 9
Figure 9
Model. The MRE11 GAR motif is required for IR-induced ssDNA resection and ATR activation but not for ATM activation. Defects in the MRE11 GAR motif lead to defects in RPA-ssDNA complexes, leading to defects in ATR and CHK1 activation. Subsequently, RAD51 cannot be properly recruited, leading to DNA repair defects and genomic instability.

References

    1. Bedford MT, Richard S. Arginine methylation an emerging regulator of protein function. Mol Cell. 2005;18:263–272. - PubMed
    1. Bedford MT, Clarke SG. Protein arginine methylation in mammals: who, what, and why. Mol Cell. 2009;33:1–13. - PMC - PubMed
    1. Tang J, Kao PN, Herschman HR. Protein-arginine methyltransferase I, the predominant protein-arginine methyltransferase in cells, interacts with and is regulated by interleukin enhancer-binding factor 3. J Biol Chem. 2000;275:19866–19876. - PubMed
    1. Pawlak MR, Scherer CA, Chen J, Roshon MJ, Ruley HE. Arginine N-methyltransferase 1 is required for early postimplantation mouse development, but cells deficient in the enzyme are viable. Mol Cell Biol. 2000;20:4859–4869. - PMC - PubMed
    1. Yu Z, Chen T, Hébert J, Li E, Richard S. A mouse PRMT1 null allele defines an essential role for arginine methylation in genome maintenance and cell proliferation. Mol Cell Biol. 2009;29:2982–2996. - PMC - PubMed

Publication types

MeSH terms