

Lessons from history for designing and validating epidemiological surveillance in uncounted populations
- PMID: 21826215
- PMCID: PMC3149617
- DOI: 10.1371/journal.pone.0022897
Lessons from history for designing and validating epidemiological surveillance in uncounted populations
Abstract
Background: Due to scanty individual health data in low- and middle-income countries (LMICs), health planners often use imperfect data sources. Frequent national-level data are considered essential, even if their depth and quality are questionable. However, quality in-depth data from local sentinel populations may be better than scanty national data, if such local data can be considered as nationally representative. The difficulty is the lack of any theoretical or empirical basis for demonstrating that local data are representative where data on the wider population are unavailable. Thus these issues can only be explored empirically in a complete individual dataset at national and local levels, relating to a LMIC population profile.
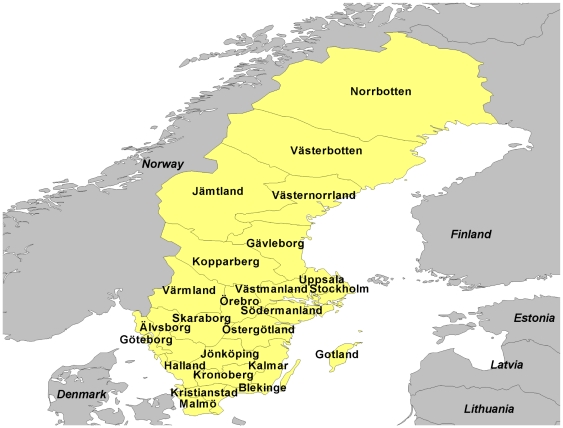
Methods and findings: Swedish national data for 1925 were used, characterised by relatively high mortality, a low proportion of older people and substantial mortality due to infectious causes. Demographic and socioeconomic characteristics of Sweden then and LMICs now are very similar. Rates of livebirths, stillbirths, infant and cause-specific mortality were calculated at national and county levels. Results for six million people in 24 counties showed that most counties had overall mortality rates within 10% of the national level. Other rates by county were mostly within 20% of national levels. Maternal mortality represented too rare an event to give stable results at the county level.
Conclusions: After excluding obviously outlying counties (capital city, island, remote areas), any one of the remaining 80% closely reflected the national situation in terms of key demographic and mortality parameters, each county representing approximately 5% of the national population. We conclude that this scenario would probably translate directly to about 40 LMICs with populations under 10 million, and to individual states or provinces within about 40 larger LMICs. Unsubstantiated claims that local sub-national population data are "unrepresentative" or "only local" should not therefore predominate over likely representativity.
Conflict of interest statement
Figures


Similar articles
-
Under-5 mortality in 2851 Chinese counties, 1996-2012: a subnational assessment of achieving MDG 4 goals in China.Lancet. 2016 Jan 16;387(10015):273-83. doi: 10.1016/S0140-6736(15)00554-1. Epub 2015 Oct 26. Lancet. 2016. PMID: 26510780 Free PMC article.
-
The state of hypertension care in 44 low-income and middle-income countries: a cross-sectional study of nationally representative individual-level data from 1·1 million adults.Lancet. 2019 Aug 24;394(10199):652-662. doi: 10.1016/S0140-6736(19)30955-9. Epub 2019 Jul 18. Lancet. 2019. PMID: 31327566
-
CDC National Health Report: leading causes of morbidity and mortality and associated behavioral risk and protective factors--United States, 2005-2013.MMWR Suppl. 2014 Oct 31;63(4):3-27. MMWR Suppl. 2014. PMID: 25356673
-
Surveillance for equity in primary health care: policy implications from international experience.Int J Epidemiol. 1992 Dec;21(6):1043-9. doi: 10.1093/ije/21.6.1043. Int J Epidemiol. 1992. PMID: 1483808 Review.
-
Global, regional, and national prevalence and risk factors for peripheral artery disease in 2015: an updated systematic review and analysis.Lancet Glob Health. 2019 Aug;7(8):e1020-e1030. doi: 10.1016/S2214-109X(19)30255-4. Lancet Glob Health. 2019. PMID: 31303293
Cited by
-
Association between vision impairment and mortality: a systematic review and meta-analysis.Lancet Glob Health. 2021 Apr;9(4):e418-e430. doi: 10.1016/S2214-109X(20)30549-0. Epub 2021 Feb 16. Lancet Glob Health. 2021. PMID: 33607015 Free PMC article.
-
Cohort Profile: South African Population Research Infrastructure Network (SAPRIN).Int J Epidemiol. 2022 Aug 10;51(4):e206-e216. doi: 10.1093/ije/dyab261. Int J Epidemiol. 2022. PMID: 34966919 Free PMC article. No abstract available.
-
Health and demographic surveillance systems: a step towards full civil registration and vital statistics system in sub-Sahara Africa?BMC Public Health. 2012 Sep 5;12:741. doi: 10.1186/1471-2458-12-741. BMC Public Health. 2012. PMID: 22950896 Free PMC article.
-
Hyak mortality monitoring system: innovative sampling and estimation methods - proof of concept by simulation.Glob Health Epidemiol Genom. 2018 Feb 5;3:e3. doi: 10.1017/gheg.2017.15. eCollection 2018. Glob Health Epidemiol Genom. 2018. PMID: 29868228 Free PMC article.
-
Assessment of the consistency of health and demographic surveillance and household survey data: A demonstration at two HDSS sites in The Gambia.PLoS One. 2022 Jul 13;17(7):e0271464. doi: 10.1371/journal.pone.0271464. eCollection 2022. PLoS One. 2022. PMID: 35830461 Free PMC article.
References
-
- Byass P. The Imperfect World of Global Health Estimates. PLoS Med. 2010;7:e1001006. doi: 10.1371/journal.pmed.1001006. - DOI - PMC - PubMed
-
- The PLoS Medicine Editors. Can We Count on Global Health Estimates? PLoS Med. 2010;7:e1001002. doi: 10.1371/journal.pmed.1001002. - DOI - PMC - PubMed
-
- Chan M, Kazatchkine M, Lob-Levyt J, Obaid T, Schweizer J, et al. Meeting the demand for results and accountability: A call for action on health data from eight global health agencies. PLoSMed. 2010;7:e1000223. doi: 10.1371/journal.pmed.1000223. - DOI - PMC - PubMed
-
- Bangha M, Diagne A, Bawah A, Sankoh O. Monitoring the millennium development goals: the potential role of the INDEPTH Network. Glob Health Action. 2010;3:5517. doi: 10.3402/gha.v3i0.5517. - DOI - PMC - PubMed
Publication types
MeSH terms
LinkOut - more resources
Full Text Sources
