. 2011;6(8):e23205.
doi: 10.1371/journal.pone.0023205. Epub 2011 Aug 3.

Modulation of glucose transporter 1 (GLUT1) expression levels alters mouse mammary tumor cell growth in vitro and in vivo

Affiliations

Modulation of glucose transporter 1 (GLUT1) expression levels alters mouse mammary tumor cell growth in vitro and in vivo

Christian D Young et al. PLoS One. 2011.

Abstract

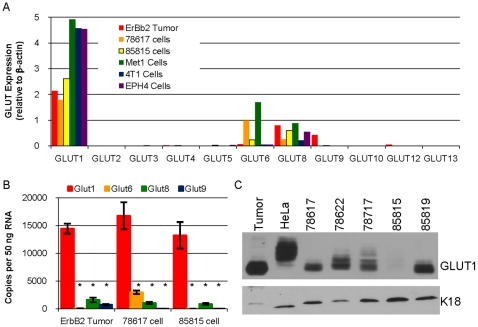
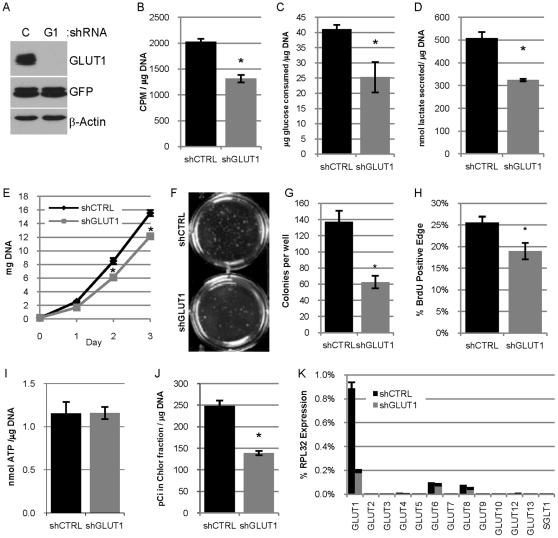
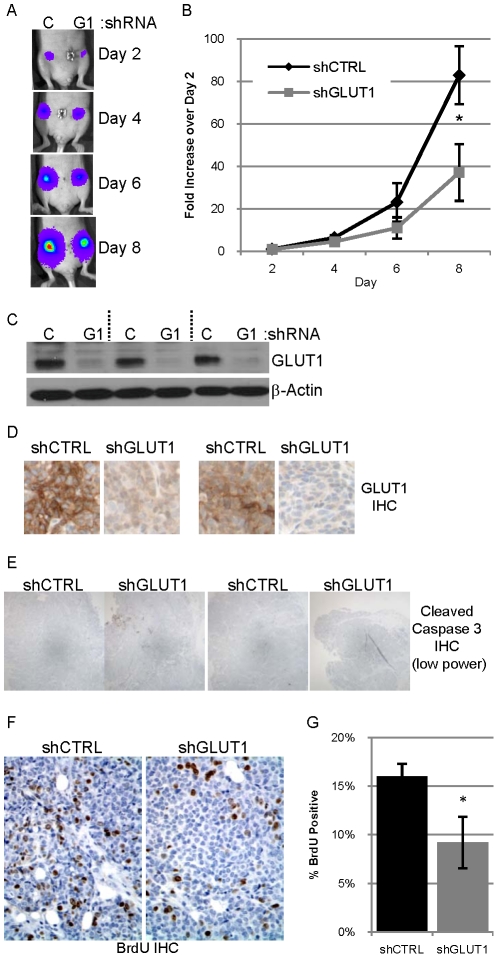
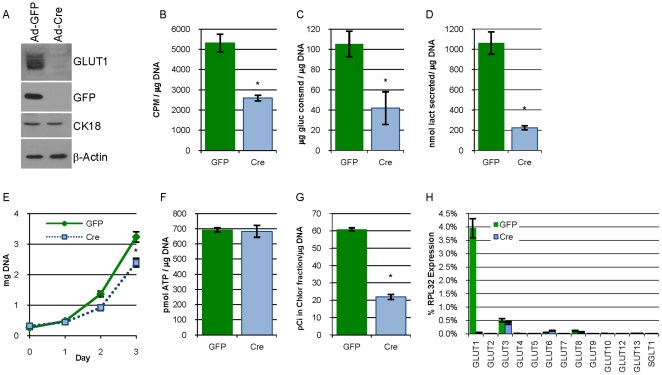
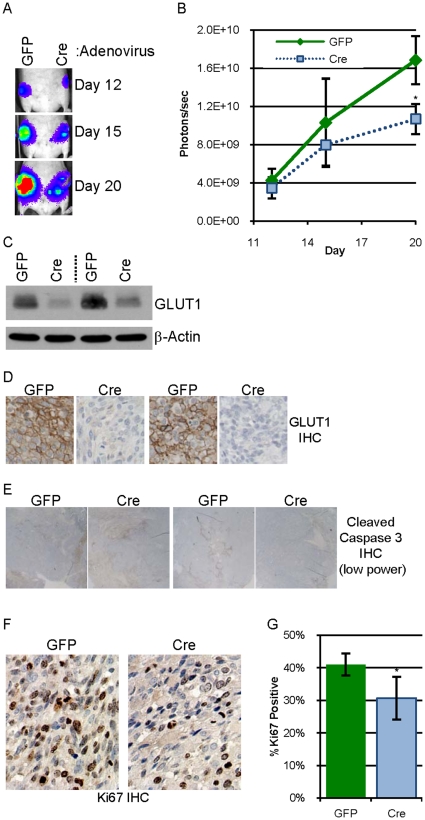
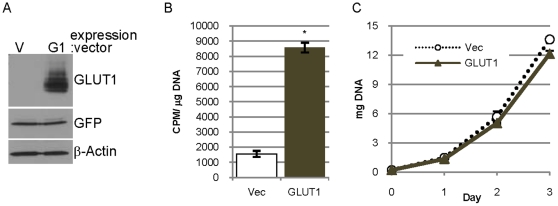
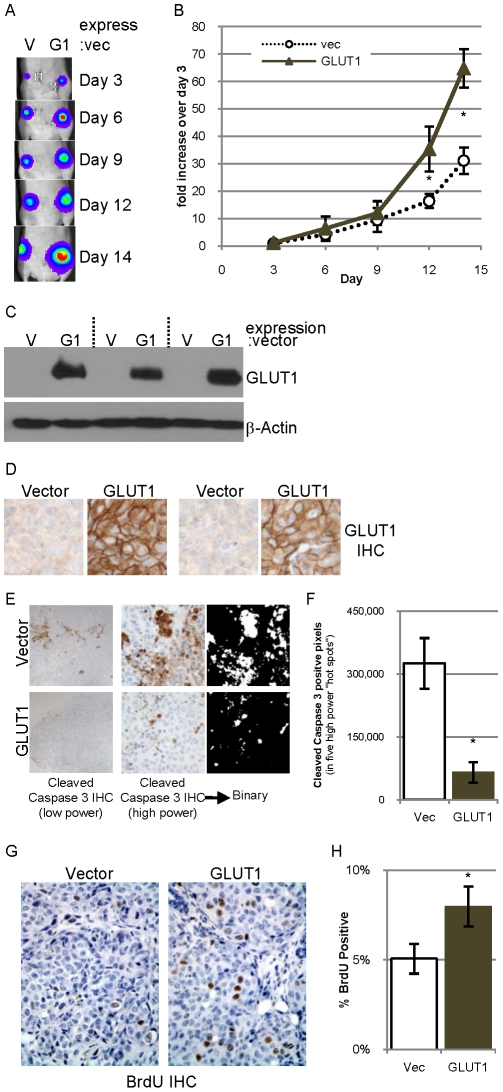
Tumor cells exhibit an altered metabolism characterized by elevated aerobic glycolysis and lactate secretion which is supported by an increase in glucose transport and consumption. We hypothesized that reducing or eliminating the expression of the most prominently expressed glucose transporter(s) would decrease the amount of glucose available to breast cancer cells thereby decreasing their metabolic capacity and proliferative potential.Of the 12 GLUT family glucose transporters expressed in mice, GLUT1 was the most abundantly expressed at the RNA level in the mouse mammary tumors from MMTV-c-ErbB2 mice and cell lines examined. Reducing GLUT1 expression in mouse mammary tumor cell lines using shRNA or Cre/Lox technology reduced glucose transport, glucose consumption, lactate secretion and lipid synthesis in vitro without altering the concentration of ATP, as well as reduced growth on plastic and in soft agar. The growth of tumor cells with reduced GLUT1 expression was impaired when transplanted into the mammary fat pad of athymic nude mice in vivo. Overexpression of GLUT1 in a cell line with low levels of endogenous GLUT1 increased glucose transport in vitro and enhanced growth in nude mice in vivo as compared to the control cells with very low levels of GLUT1.These studies demonstrate that GLUT1 is the major glucose transporter in mouse mammary carcinoma models overexpressing ErbB2 or PyVMT and that modulation of the level of GLUT1 has an effect upon the growth of mouse mammary tumor cell lines in vivo.


Conflict of interest statement

Competing Interests: The authors have declared that no competing interests exist.

Figures

Figure 1
Figure 1. GLUT1 is the most abundantly expressed GLUT family member in MMTV-c-ErbB2 tumors and a number of mouse mammary carcinoma cell lines.
A. qPCR analysis to determine the expression of GLUT1–GLUT6, GLUT8–GLUT10, GLUT12–GLUT13 (eleven of the twelve mouse GLUT family transporters) relative to β-actin expression was performed with the cDNA equivalent of 50 ng RNA in six samples: mammary tumor from a MMTV-c-ErbB2 mouse (ErbB2 tumor), two different cell lines derived from these tumors (78617 and 85815), a cell line derived from a MMTV-PyVMT mouse mammary tumor (Met1), a cell line derived from a BALB/c mouse mammary tumor (4T1) and immortalized mouse mammary epithelial cells (EPH4). B. Quantitation of the number of copies of GLUT1, GLUT6, GLUT8 and GLUT9 RNA in the cDNA derived from 50 ng RNA from triplicate samples of ErbB2 Tumors, 78617 cells and 85815 cells. * indicates p<0.05 for GLUT1 expression versus the other transporters as determined by Bonferroni post-hoc tests. C. Immunoblot analysis of GLUT1 and keratin 18 (K18) in lysates of an MMTV-c-ErbB2 tumor (tumor), HeLa cells, and five different MMTV-c-ErbB2 tumor cell lines (78617, 78622, 78717, 85815 and 85819).
Figure 2
Figure 2. Reduced expression of GLUT1 in 78617GL cells decreases glucose usage, lipid synthesis and proliferation in vitro.
A. Immunoblot analysis evaluating the expression of GLUT1, GFP-Luciferase transgene (GFP) and β-actin in lysates from 78617GL cells expressing control shRNA (C) or GLUT1 shRNA (G1). B. Uptake of 3H-2-deoxyglucose by 78617GL cells expressing control shRNA (shCTRL) or GLUT1 shRNA (shGLUT1) in 15 minutes presented as CPM per µg DNA. C–D. Glucose consumption (C) and lactate secretion (D). Glucose and lactate concentrations are normalized to the DNA content of the cultures. E. Proliferation is estimated by deteriming the DNA content of cultures at days 0, 1, 2 and 3 post-seeding. F–G. 78617GL cells were grown in soft agar for 3 weeks and colonies are pictured in F and the number of colonies per well is quantified in G. H. Quantification of BrdU positive cells in the outer edge of 12 colonies of each group. I. The concentration of ATP in the two groups of cells (lacking luciferase expression) was determined and normalized to the DNA content of parallel monolayers. J. Lipid synthesis was measured by determining the amount of 14C in the non-aqueous chloroform fraction of methanol chloroform extracted cell lysates after 24 hour incubation with 14C-glucose and is normalized to the DNA content of parallel samples. K. qPCR analysis evaluating the expression of the 12 mouse GLUT transporters and SGLT1 in 78617GL cells expressing control shRNA or GLUT1 shRNA normalized to RPL32 expression.
Figure 3
Figure 3. Reduced expression of GLUT1 in 78617GL cells decreases tumor growth.
A. 0.5 million 78617GL cells expressing control shRNA (C) or GLUT1 shRNA (G1) were injected into contralateral #4 mammary fat pads of athymic nude mice. Bioluminescence from the labeled tumor cells was detected on days 2, 4, 6 and 8 after implantation. The abdominal region heat map depicting luciferase activity of a representative mouse is pictured. B. The average bioluminescence on days 2, 4, 6 and 8 normalized to the day 2 bioluminescence +/− SEM for five mice is presented with the black diamonds representing shCTRL tumors and grey squares representing shGLUT1 tumors. C. Expression of GLUT1 and β-actin in lysates of three tumor pairs evaluated by immunoblot analysis. D. GLUT1 expression evaluated by IHC (with hematoxylin counterstain) in two tumor pairs. E. Representative low power photomicrographs of two pairs of tumor sections immunostained for cleaved caspase 3. F–G. Representative high power photomicrographs of a tumor pair immunostained for BrdU with hematoxylin counterstain (F) which is quantified (G).
Figure 4
Figure 4. Eliminating expression of GLUT1 in G1fP cells decreases glucose usage, lipid synthesis and proliferation in vitro.
A. Immunoblot analysis evaluating the expression of GLUT1, GFP, CK18, and β-actin in lysates from GLUT1 fl/fl mammary cells transformed with PyVMT (G1fP cells) 72 hours after being infected with adenovirus expressing GFP (Ad-GFP) or Cre recombinase (Ad-Cre) at an MOI of 100. B–D. Uptake of 3H-2-deoxyglucose (B), glucose consumption (C), and lactate secretion (D) by G1fP cells previously infected with Ad-GFP or Ad-Cre as described in figure 2. E. Proliferation is estimated by determining the DNA content of cultures at days 0, 1, 2 and 3 post-seeding. F. The concentration of ATP in the two groups of cells was determined and normalized to the DNA content of parallel monolayers. G. Lipid synthesis in G1fP cells was measured as described in figure 2. H. qPCR analysis evaluating the expression of the 12 mouse GLUT transporters and SGLT1 normalized to RPL32 expression in G1fP cells that had been infected two weeks prior with Ad-GFP or Ad-Cre.
Figure 5
Figure 5. Elimination of GLUT1 expression in G1fPt cells decreases tumor growth.
A. 0.5 million G1fPt cells infected two weeks prior with adenovirus expressing GFP or Cre recombinase were injected into contralateral #4 mammary fat pads of athymic nude mice. Bioluminescence from the labeled tumor cells was detected on days 12, 15 and 20 after implantation. The abdominal region heat map depicting luciferase activity of a representative mouse is pictured. B. The average bioluminescence on days 12, 15 and 20 +/− SEM for eight mice is presented with green diamonds representing “GFP” tumors and light blue squares representing “Cre” tumors. C. Expression of GLUT1 and β-actin in lysates of two tumor pairs evaluated by immunoblot analysis. D. GLUT1 expression evaluated by IHC (with hematoxylin counterstain) in two tumor pairs. E. Representative low power photomicrographs of two pairs of tumor sections immunostained for cleaved caspase 3. F–G. Representative high power photomicrographs of a tumor pair immunostained for Ki67 with hematoxylin counterstain (F) which is quantified (G).
Figure 6
Figure 6. Overexpression of GLUT1 in 85815GL cells increases glucose transport without increasing proliferation.
A. Expression of GLUT1, GFP-luciferase and β-actin in lysates of 85815GL cells expressing empty vector (V) or overexpressing GLUT1 (G1). B. Uptake of 3H-2-deoxyglucose by cells expressing empty vector (Vec) or GLUT1 (GLUT1) in 15 minutes presented as CPM per µg DNA. C. Proliferation is estimated by determining the DNA content of cultures expressing empty vector or GLUT1 at days 0, 1, 2 and 3.
Figure 7
Figure 7. Overexpression of GLUT1 in 85815GL cells accelerates tumor formation.
A. 0.4 million 85815GL cells expressing control vector (V) or GLUT1 (G1) were injected into contralateral #4 mammary fat pads of athymic nude mice. Bioluminescence from the labeled tumor cells was detected on days 3, 6, 9, 12 and 14 after implantation. B. The bioluminescence on days 3, 6, 9, 12 and 14 normalized to the day 3 value was averaged for all five mice and is presented +/−SEM. C. GLUT1 and β-actin expression evaluated in lysates of three tumor pairs by immunoblot analysis. D. GLUT1 expression evaluated by IHC in two tumor pairs. E. Low power photomicrographs of a pair of tumor sections derived from a vector control tumor (top) and a tumor overexpressing GLUT1 (bottom) immunostained for cleaved caspase 3 (left). High power photomicrographs of a pair of tumor sections immunostained for cleaved caspase 3 (middle), which are converted to binary pictures (right). F. Quantification of the number of cleaved caspase 3 positive pixels in five high power field “hot spots” in four tumors of each group. G–H. Representative high power photomicrographs of tumor sections immunostained for BrdU with hematoxylin counterstain (G) which is quantified (H).

References

    1. Warburg O. The Metabolism of Tumors. London: Constable; 1930.
    1. Tran A, Pio BS, Khatibi B, Czernin J, Phelps ME, et al. 18F-FDG PET for staging breast cancer in patients with inner-quadrant versus outer-quadrant tumors: comparison with long-term clinical outcome. J Nucl Med. 2005;46:1455–1459. - PubMed
    1. Semenza GL. Regulation of cancer cell metabolism by hypoxia-inducible factor 1. Semin Cancer Biol. 2009;19:12–16. - PubMed
    1. Semenza GL, Artemov D, Bedi A, Bhujwalla Z, Chiles K, et al. ‘The metabolism of tumours’: 70 years later. Novartis Found Symp. 2001;240:251–260; discussion 260–254. - PubMed
    1. Gordan JD, Simon MC. Hypoxia-inducible factors: central regulators of the tumor phenotype. Curr Opin Genet Dev. 2007;17:71–77. - PMC - PubMed

Publication types