Review
. 2011 Oct 7;136(19):3854-64.
doi: 10.1039/c1an15286f. Epub 2011 Aug 8.

Top-down mass spectrometry: recent developments, applications and perspectives

Affiliations
Review

Top-down mass spectrometry: recent developments, applications and perspectives

Weidong Cui et al. Analyst. .

Abstract

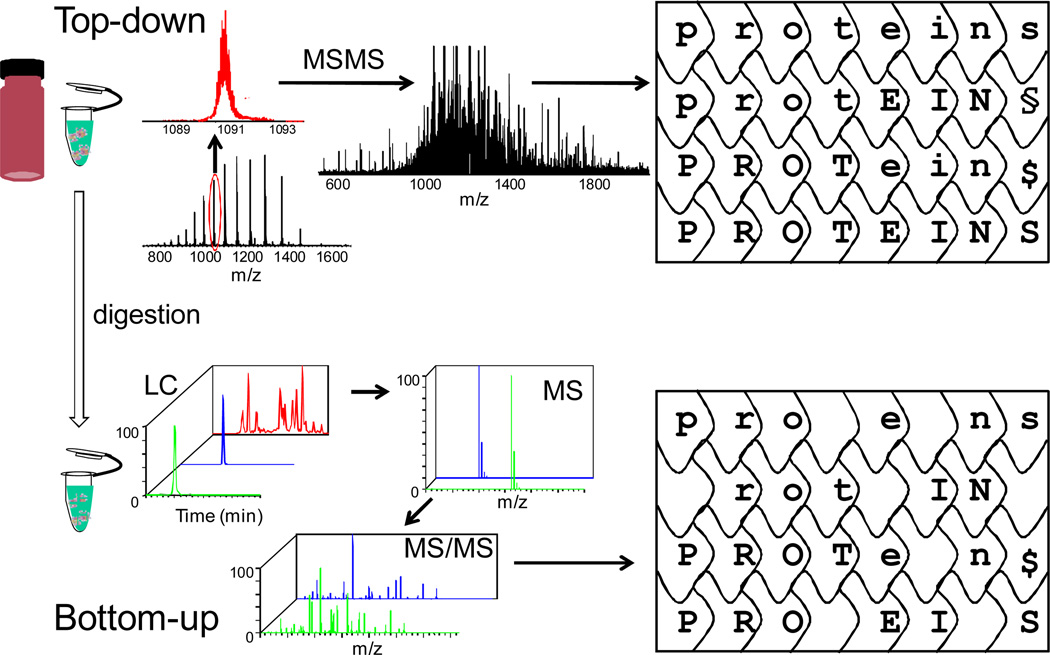
Top-down mass spectrometry is an emerging approach for the analysis of intact proteins. The term was coined as a contrast with the better-established, bottom-up strategy for analysis of peptide fragments derived from digestion, either enzymatically or chemically, of intact proteins. Although the term top-down originates from proteomics, it can also be applied to mass spectrometric analysis of intact large biomolecules that are constituents of protein assemblies or complexes. Traditionally, mass spectrometry has usually started with intact molecules, and in this regard, top-down approaches reflect the spirit of mass spectrometry. This article provides an overview of the methodologies in top-down mass spectrometry and then reviews applications covering protein posttranslational modifications, protein biophysics, DNAs/RNAs, and protein assemblies. Finally, challenges and future directions are discussed.


Figures

Figure 1
Figure 1
Comparison of top-down and bottom-up workflows.
Figure 2
Figure 2
MSWIFT device for isoelectric point-based separation. Reprinted from ref. , J. Am. Soc. Mass Spectrom., 2010, 9, 1612–1619, with permission of the American Society for Mass Spectrometry.
Figure 3
Figure 3
Temporal structure evolution of globular proteins after ESI - ref. Proc. Natl. Acad. Sci. U.S.A., 2008, 105, 18145–18152, copyright of the National Academy of Sciences.
Figure 4
Figure 4
Crystal structure of yeast ADH tetramer (PDB code 2HCY). The lower left subunit is shown in B-factor scale where the N-terminus has the highest B-factor value. In each of the other three subunits, the sequenced N-terminal region up to the 55th residue by ECD is highlighted in red – ref .
Figure 5
Figure 5
Triple quadrupole instrument with the 2nd Q replaced with a RF-free magnetic cell for ECD and CAD – ref , Rapid Commun. Mass Spectrom., 2009, 23, 3028–3030, copyright of John Wiley & Sons.

References

    1. JRR Yates CI, Nakorchevsky A. Annu. Rev. Biomed. Eng. 2009;11:49–79. - PubMed
    1. SL Matallana-Surget B, Wattiez R. Expert Rev. Proteomics. 2010;7:5–7. - PubMed
    1. Zubarev RA, Kelleher NL, McLafferty FW. J. Am. Chem. Soc. 1998;120:3265–3266.
    1. Syka JEP, Coon JJ, Schroeder MJ, Shabanowitz J, Hunt DF. Proc. Natl. Acad. Sci. USA. 2004;101:9528–9533. - PMC - PubMed
    1. Chait BT. Science. 2006;314:65–66. - PubMed

Publication types

MeSH terms