

Dissociable neural correlates of contour completion and contour representation in illusory contour perception
- PMID: 21826763
- PMCID: PMC6870262
- DOI: 10.1002/hbm.21371
Dissociable neural correlates of contour completion and contour representation in illusory contour perception
Abstract
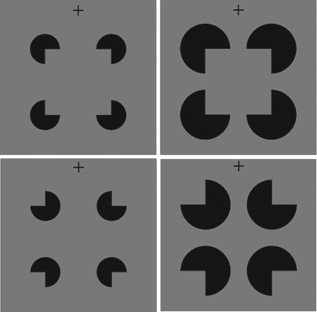
Object recognition occurs even when environmental information is incomplete. Illusory contours (ICs), in which a contour is perceived though the contour edges are incomplete, have been extensively studied as an example of such a visual completion phenomenon. Despite the neural activity in response to ICs in visual cortical areas from low (V1 and V2) to high (LOC: the lateral occipital cortex) levels, the details of the neural processing underlying IC perception are largely not clarified. For example, how do the visual areas function in IC perception and how do they interact to archive the coherent contour perception? IC perception involves the process of completing the local discrete contour edges (contour completion) and the process of representing the global completed contour information (contour representation). Here, functional magnetic resonance imaging was used to dissociate contour completion and contour representation by varying each in opposite directions. The results show that the neural activity was stronger to stimuli with more contour completion than to stimuli with more contour representation in V1 and V2, which was the reverse of that in the LOC. When inspecting the neural activity change across the visual pathway, the activation remained high for the stimuli with more contour completion and increased for the stimuli with more contour representation. These results suggest distinct neural correlates of contour completion and contour representation, and the possible collaboration between the two processes during IC perception, indicating a neural connection between the discrete retinal input and the coherent visual percept.
Copyright © 2011 Wiley Periodicals, Inc.
Figures


References
-
- Csibra G, Davis G, Spratling MW, Johnson MH ( 2000): Gamma oscillations and object processing in the infant brain. Science 290: 1582–1585. - PubMed
-
- Engel SA, Glover GH, Wandell BA ( 1997): Retinotopic organization in human visual cortex and the spatial precision of functional MRI. Cereb Cortex 7: 181–192. - PubMed
-
- Fang F, He S ( 2005): Cortical responses to invisible objects in the human dorsal and ventral pathways. Nat Neurosci 8: 1380–1385. - PubMed
-
- Ffytche DH, Zeki S ( 1996): Brain activity related to the perception of illusory contours. Neuroimage 3: 104–108. - PubMed
-
- Grill‐Spector K, Malach R ( 2004): The human visual cortex. Annu Rev Neurosci 27: 649–677. - PubMed
Publication types
MeSH terms
LinkOut - more resources
Full Text Sources
