. 2011 Sep 30;286(39):34426-39.
doi: 10.1074/jbc.M111.257444. Epub 2011 Aug 2.

Proteolipidic composition of exosomes changes during reticulocyte maturation

Affiliations

Proteolipidic composition of exosomes changes during reticulocyte maturation

Kévin Carayon et al. J Biol Chem. .

Abstract

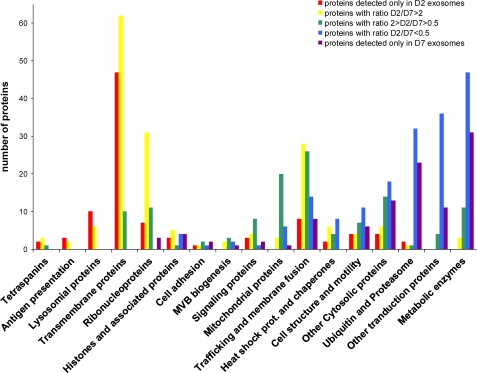
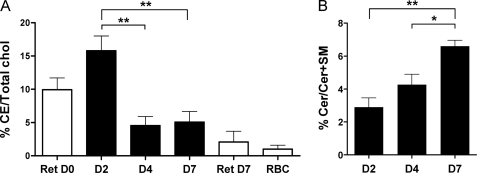
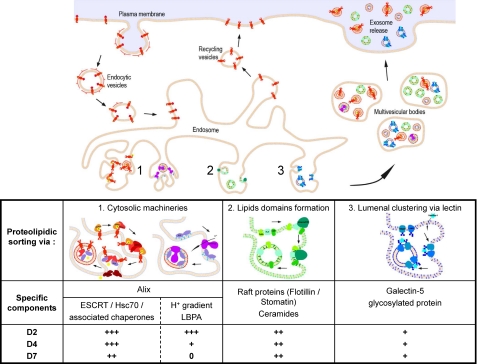
During the orchestrated process leading to mature erythrocytes, reticulocytes must synthesize large amounts of hemoglobin, while eliminating numerous cellular components. Exosomes are small secreted vesicles that play an important role in this process of specific elimination. To understand the mechanisms of proteolipidic sorting leading to their biogenesis, we have explored changes in the composition of exosomes released by reticulocytes during their differentiation, in parallel to their physical properties. By combining proteomic and lipidomic approaches, we found dramatic alterations in the composition of the exosomes retrieved over the course of a 7-day in vitro differentiation protocol. Our data support a previously proposed model, whereby in reticulocytes the biogenesis of exosomes involves several distinct mechanisms for the preferential recruitment of particular proteins and lipids and suggest that the respective prominence of those pathways changes over the course of the differentiation process.


Figures

FIGURE 1.
FIGURE 1.
Monitoring the viability of reticulocytes during their culture in vitro. The physical characteristics of reticulocytes (FSC/side size scatter (SSC) profiles) were recorded just after their purification on a Percoll gradient (D0) and when the medium was changed on D2, D4, D7, and D10. Those were compared with red blood cells (RBC) obtained from an untreated rat. The dotted lines indicate the position of the peak FSC value of RBC (125,000), and the dashed lines indicate that of the peak FSC value of D0 reticulocytes (92,000). Similar results were obtained in three other independent experiments.
FIGURE 2.
FIGURE 2.
Flow cytometry monitoring of in vitro maturation of reticulocytes. On all three graphs, the different color curves correspond to the following days: D0 (red), D2 (green), D4 (blue), D7 (purple); control, unstained reticulocytes (black); and RBC obtained from an untreated rat (gray). A, TfR expression, as revealed by binding of Alexa647-conjugated human transferrin. B, intracellular RNA, revealed with Syto12 staining. C, cell surface MHC-I, stained with MRC-OX18, followed by secondary anti-mouse antibody conjugated to Alexa488. Staining with F16-4-4 gave comparable results (data not shown). Similar results were obtained in 10 other independent experiments.
FIGURE 3.
FIGURE 3.
Morphological and physical characterization of the vesicles harvested on D2, D4, and D7. A, images obtained by transmission electron microscopy on the exosomes collected at D2 (right), D4 (middle), and D7 (left); scale bar, 100 nm. B, distribution and the mean ± S.D. for the diameters of the exosomes harvested at D2, D4, and D7 of culture, measured by the software AMT Advantage HR camera system. Similar results were obtained in two experiments. *, differences between D7 and D4 or D2 were found to be highly significant with a t test (p value < 0.001). C, fluorescence anisotropy values measured for DPH inserted in D2, D4, and D7 exosomes, as well as in various small unilamellar vesicles used as control for the three different physical states encountered in lipid bilayers as follows: gel (so) liquid ordered (lo), and liquid disordered (ld). Color code: exosome preparations: D2 (green), D4 (blue), and D7 (purple); small unilamellar vesicle suspensions: DPPC without chol (gray dash) so > ld transition; POPC without chol (black dash) ld; DPPC with 40% chol (gray dots) stable lo; POPC with 40% chol (black dots) stable lo; POPC with 30% chol and 30% SM (black dash-dot-dash) stable lo. D and E, SDS-PAGE analysis of sucrose gradients fractions isolated at D2 (D) and D7 (E) revealed by Coomassie Blue.
FIGURE 4.
FIGURE 4.
Comparison of the protein patterns of D2, D4, and D7 exosomes. 20 μg of exosomal proteins were separated on an SDS-polyacrylamide gradient gel (4–12%), and stained with Coomassie Blue. Boxes indicate the positions of two types of proteins that were dominating strongly in the mass spectrometry analysis: histone chains around 16 kDa, which decreased very significantly at D7, and hemoglobin chains around 12 kDa, which were most prominent at D7.
FIGURE 5.
FIGURE 5.
Western blot analysis of D2, D4, and D7 exosomes. Exosome samples, each containing 9 μg of proteins, and whole cell lysates of fresh reticulocytes (50 μg of protein) were separated on 4–12% SDS-PAGE before transferring onto nitrocellulose. A, analysis of selected components of the ESCRT complexes. B, analysis of other cellular components. Left panel, representative Ponceau red staining of one of the three membranes used. Membranes were then incubated with the indicated primary antibodies and then with HRP-conjugated secondary antibodies, before revealing using ECL® with the indicated exposure times. For all panels, similar results were obtained in at least one other experiment.
FIGURE 6.
FIGURE 6.
Global analysis of the changes in the types of proteins identified in D2 versus D7 exosomes. Each one of the more than 700 proteins identified in our analyses (see supplemental Table S1) was classified into one of 17 broad families, and the individual D2/D7 ratios were determined based on the number of MS/MS peaks, as described under “Materials and Methods.” The graph shows the number of proteins identified in each of the different families as a function of those D2/D7 ratios.
FIGURE 7.
FIGURE 7.
Lipidomic analysis of D2, D4, and D7 exosomes. The lipid content of exosomes was determined as detailed under “Materials and Methods.” A, ratios of CE over total cholesterol were dramatically increased in D2 exosomes. B, proportion of ceramides over (ceramides + SM) increased over time. The statistical significance of the differences observed was evaluated with a t test. *, p < 0.05; **, p < 0.01).
FIGURE 8.
FIGURE 8.
Scheme of different pathways for biogenesis of exosomes in reticulocytes and hypothetical changes in their respective importance in generation of D2, D4, and D7 exosomes.

Similar articles

Cited by

References

    1. Chasis J. A., Mohandas N. (2008) Blood 112, 470–478 - PMC - PubMed
    1. Mel H. C., Prenant M., Mohandas N. (1977) Blood 49, 1001–1009 - PubMed
    1. Gronowicz G., Swift H., Steck T. L. (1984) J. Cell Sci. 71, 177–197 - PubMed
    1. Koury M. J., Koury S. T., Kopsombut P., Bondurant M. C. (2005) Blood 105, 2168–2174 - PubMed
    1. Harding C., Heuser J., Stahl P. (1983) J. Cell Biol. 97, 329–339 - PMC - PubMed

Publication types

LinkOut - more resources