

Reduced expression of adipose triglyceride lipase enhances tumor necrosis factor alpha-induced intercellular adhesion molecule-1 expression in human aortic endothelial cells via protein kinase C-dependent activation of nuclear factor-kappaB
- PMID: 21828047
- PMCID: PMC3173212
- DOI: 10.1074/jbc.M111.285650
Reduced expression of adipose triglyceride lipase enhances tumor necrosis factor alpha-induced intercellular adhesion molecule-1 expression in human aortic endothelial cells via protein kinase C-dependent activation of nuclear factor-kappaB
Abstract
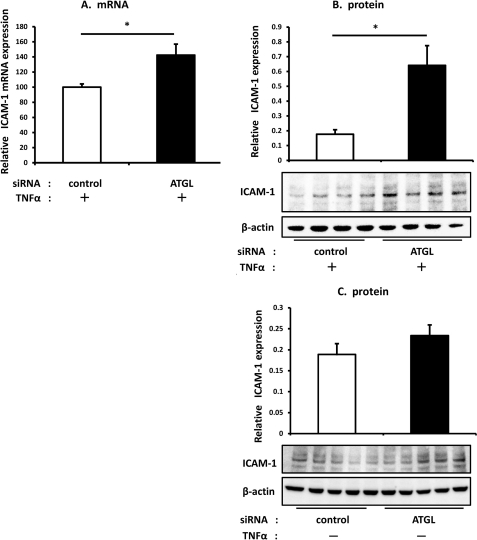
We examined the effects of adipose triglyceride lipase (ATGL) on the initiation of atherosclerosis. ATGL was recently identified as a rate-limiting triglyceride (TG) lipase. Mutations in the human ATGL gene are associated with neutral lipid storage disease with myopathy, a rare genetic disease characterized by excessive accumulation of TG in multiple tissues. The cardiac phenotype, known as triglyceride deposit cardiomyovasculopathy, shows massive TG accumulation in both coronary atherosclerotic lesions and the myocardium. Recent reports show that myocardial triglyceride content is significantly higher in patients with prediabetes or diabetes and that ATGL expression is decreased in the obese insulin-resistant state. Therefore, we investigated the effect of decreased ATGL activity on the development of atherosclerosis using human aortic endothelial cells. We found that ATGL knockdown enhanced monocyte adhesion via increased expression of TNFα-induced intercellular adhesion molecule-1 (ICAM-1). Next, we determined the pathways (MAPK, PKC, or NFκB) involved in ICAM-1 up-regulation induced by ATGL knockdown. Both phosphorylation of PKC and degradation of IκBα were increased in ATGL knockdown human aortic endothelial cells. In addition, intracellular diacylglycerol levels and free fatty acid uptake via CD36 were significantly increased in these cells. Inhibition of the PKC pathway using calphostin C and GF109203X suppressed TNFα-induced ICAM-1 expression. In conclusion, we showed that ATGL knockdown increased monocyte adhesion to the endothelium through enhanced TNFα-induced ICAM-1 expression via activation of NFκB and PKC. These results suggest that reduced ATGL expression may influence the atherogenic process in neutral lipid storage diseases and in the insulin-resistant state.
Figures


Similar articles
-
Inhibition of aldose reductase attenuates TNF-alpha-induced expression of adhesion molecules in endothelial cells.FASEB J. 2004 Aug;18(11):1209-18. doi: 10.1096/fj.04-1650com. FASEB J. 2004. PMID: 15284221
-
Chlamydophila pneumoniae induces ICAM-1 expression in human aortic endothelial cells via protein kinase C-dependent activation of nuclear factor-kappaB.Circ Res. 2003 May 30;92(10):1130-7. doi: 10.1161/01.RES.0000074001.46892.1C. Epub 2003 Apr 24. Circ Res. 2003. PMID: 12714566
-
c-Src-dependent tyrosine phosphorylation of IKKbeta is involved in tumor necrosis factor-alpha-induced intercellular adhesion molecule-1 expression.J Biol Chem. 2003 Mar 14;278(11):9944-52. doi: 10.1074/jbc.m208521200. J Biol Chem. 2003. PMID: 12645577
-
Postprandial lipoproteins and the molecular regulation of vascular homeostasis.Prog Lipid Res. 2013 Oct;52(4):446-64. doi: 10.1016/j.plipres.2013.06.001. Epub 2013 Jun 15. Prog Lipid Res. 2013. PMID: 23774609 Review.
-
The Diagnostic Criteria 2020 for Triglyceride Deposit Cardiomyovasculopathy.Ann Nucl Cardiol. 2020;6(1):99-104. doi: 10.17996/anc.20-00131. Epub 2020 Aug 31. Ann Nucl Cardiol. 2020. PMID: 37123492 Free PMC article. Review.
Cited by
-
Prevalence and clinical outcomes of triglyceride deposit cardiomyovasculopathy among haemodialysis patients.Heart. 2021 Jan;107(2):127-134. doi: 10.1136/heartjnl-2020-317672. Epub 2020 Sep 30. Heart. 2021. PMID: 32998957 Free PMC article.
-
Triglyceride deposit cardiomyovasculopathy: a rare cardiovascular disorder.Orphanet J Rare Dis. 2019 Jun 11;14(1):134. doi: 10.1186/s13023-019-1087-4. Orphanet J Rare Dis. 2019. PMID: 31186072 Free PMC article.
-
Intercellular adhesion molecule 1: recent findings and new concepts involved in mammalian spermatogenesis.Semin Cell Dev Biol. 2014 May;29:43-54. doi: 10.1016/j.semcdb.2013.07.003. Epub 2013 Aug 11. Semin Cell Dev Biol. 2014. PMID: 23942142 Free PMC article. Review.
-
Role of lipotoxicity in endothelial dysfunction.Heart Fail Clin. 2012 Oct;8(4):589-607. doi: 10.1016/j.hfc.2012.06.012. Epub 2012 Aug 10. Heart Fail Clin. 2012. PMID: 22999242 Free PMC article. Review.
-
Dynamic metabolism of endothelial triglycerides protects against atherosclerosis in mice.J Clin Invest. 2024 Jan 4;134(4):e170453. doi: 10.1172/JCI170453. J Clin Invest. 2024. PMID: 38175710 Free PMC article.
References
-
- Rijzewijk L. J., van der Meer R. W., Smit J. W., Diamant M., Bax J. J., Hammer S., Romijn J. A., de Roos A., Lamb H. J. (2008) J. Am. Coll. Cardiol. 52, 1793–1799 - PubMed
-
- McGavock J. M., Lingvay I., Zib I., Tillery T., Salas N., Unger R., Levine B. D., Raskin P., Victor R. G., Szczepaniak L. S. (2007) Circulation 116, 1170–1175 - PubMed
-
- Kobayashi K., Inoguchi T., Maeda Y., Nakashima N., Kuwano A., Eto E., Ueno N., Sasaki S., Sawada F., Fujii M., Matoba Y., Sumiyoshi S., Kawate H., Takayanagi R. (2008) J. Clin. Endocrinol. Metab. 93, 2877–2884 - PubMed
-
- Zimmermann R., Strauss J. G., Haemmerle G., Schoiswohl G., Birner-Gruenberger R., Riederer M., Lass A., Neuberger G., Eisenhaber F., Hermetter A., Zechner R. (2004) Science 306, 1383–1386 - PubMed
-
- Jocken J. W., Langin D., Smit E., Saris W. H., Valle C., Hul G. B., Holm C., Arner P., Blaak E. E. (2007) J. Clin. Endocrinol. Metab. 92, 2292–2299 - PubMed
Publication types
MeSH terms
Substances
LinkOut - more resources
Full Text Sources
Miscellaneous
