. 2011 Oct;18(5):379-92.
doi: 10.1093/dnares/dsr025. Epub 2011 Aug 9.

Characterization of STAT6 target genes in human B cells and lung epithelial cells

Affiliations

Characterization of STAT6 target genes in human B cells and lung epithelial cells

Akinori Kanai et al. DNA Res. 2011 Oct.

Abstract

Using ChIP Seq, we identified 556 and 467 putative STAT6 target sites in the Burkitt's lymphoma cell line Ramos and in the normal lung epithelial cell line BEAS2B, respectively. We also examined the positions and expression of transcriptional start sites (TSSs) in these cells using our TSS Seq method. We observed that 44 and 132 genes in Ramos and BEAS2B, respectively, had STAT6 binding sites in proximal regions of their previously reported TSSs that were up-regulated at the transcriptional level. In addition, 406 and 109 of the STAT6 target sites in Ramos and BEAS2B, respectively, were located in proximal regions of previously uncharacterized TSSs. The target genes identified in Ramos and BEAS2B cells in this study and in Th2 cells in previous studies rarely overlapped and differed in their identity. Interestingly, ChIP Seq analyses of histone modifications and RNA polymerase II revealed that chromatin formed an active structure in regions surrounding the STAT6 binding sites; this event also frequently occurred in different cell types, although neither STAT6 binding nor TSS induction was observed. The rough landscape of STAT6-responsive sites was found to be shaped by chromatin structure, but distinct cellular responses were mainly mediated by distinct sets of transcription factors.


Figures
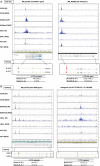
Figure 1.
Figure 1.
Identification of STAT6 target RefSeq genes. (A) Examples of identified STAT6 targets in authentic RefSeq promoter regions in Ramos cells (left panel) and BEAS2B cells (right panel). STAT6 binding sites are indicated by red lines. Expression changes evaluated by digital TSS-tag counts are also shown in the bottom margin. (B) STAT6 targets in putative alternative promoter regions (left panel) and in intergenic regions (right panel) in Ramos cells. Upper and lower panels present the results from ChIP Seq and TSS Seq analyses, respectively. The IP used for each ChIP Seq analysis is shown in the margin. WCE, whole cell extract used as a background control. (C) Frequency of STAT6 binding sites relative to RefSeq regions in Ramos cells (left panel) and BEAS2B cells (right panel). (D) Distance between STAT6 binding sites and 5′-ends of RefSeq transcript models in Ramos cells (red bar) and BEAS2B cells (blue bar). (E) Consensus sequences deduced from STAT6 binding sites in Ramos cells (upper panel) and BEAS2B cells (lower panel). (F) Fold induction of the STAT6 target TSSs evaluated by digital TSS-tag counts in STAT6-knockdown BEAS2B cells. The y-axis indicates the relative fold induction compared with that in wild-type BEAS2B cells. TSSs indicated by arrows showed reduced induction in knockdown cells.
Figure 1.
Figure 1.
Identification of STAT6 target RefSeq genes. (A) Examples of identified STAT6 targets in authentic RefSeq promoter regions in Ramos cells (left panel) and BEAS2B cells (right panel). STAT6 binding sites are indicated by red lines. Expression changes evaluated by digital TSS-tag counts are also shown in the bottom margin. (B) STAT6 targets in putative alternative promoter regions (left panel) and in intergenic regions (right panel) in Ramos cells. Upper and lower panels present the results from ChIP Seq and TSS Seq analyses, respectively. The IP used for each ChIP Seq analysis is shown in the margin. WCE, whole cell extract used as a background control. (C) Frequency of STAT6 binding sites relative to RefSeq regions in Ramos cells (left panel) and BEAS2B cells (right panel). (D) Distance between STAT6 binding sites and 5′-ends of RefSeq transcript models in Ramos cells (red bar) and BEAS2B cells (blue bar). (E) Consensus sequences deduced from STAT6 binding sites in Ramos cells (upper panel) and BEAS2B cells (lower panel). (F) Fold induction of the STAT6 target TSSs evaluated by digital TSS-tag counts in STAT6-knockdown BEAS2B cells. The y-axis indicates the relative fold induction compared with that in wild-type BEAS2B cells. TSSs indicated by arrows showed reduced induction in knockdown cells.
Figure 2.
Figure 2.
Comparison of STAT6 target genes between Ramos and BEAS2B cells. (A) GO terms associated with the STAT6 target genes identified in Ramos cells (top panel), BEAS2B cells (middle panel) and Th2 cells (bottom panel). (B) Overlap of the STAT6 target genes in Ramos cells (red), BEAS2B cells (blue) and Th2 cells (green). (C) Expression levels (left panel) and fold induction (right panels) in response to IL-4 stimulation evaluated by digital TSS-tag counts. Statistical significance between the indicated populations is shown in the margin. STAT6 target genes in Ramos and BEAS2B cells.
Figure 3.
Figure 3.
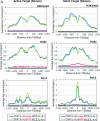
Status of histone modifications and pol II binding in the proximal regions of STAT6 target TSSs. (A) Distribution of the averaged ChIP Seq tags for H3K4me3 (top panels), H3Ac (middle panels) and pol II (bottom panels) in Ramos cells. Data from active target genes (STAT6 binding plus TSS induction in Ramos cells) are shown in the left panels, and data from silent target genes (STAT6 binding plus TSS induction in BEAS2B cells but both negative in Ramos cells) are shown in the right panels. Blue, green, red and purple lines indicate the results for the IP (IL-4 (+)), IP (IL-4 (−)), WCE (IL-4 (+)) and WCE (IL-4 (−)) experiments, respectively. On the x-axis, the position of the associated TSS is designated as zero. (B) Results of an analysis similar to that shown in (A) in BEAS2B cells.
Figure 3.
Figure 3.
Status of histone modifications and pol II binding in the proximal regions of STAT6 target TSSs. (A) Distribution of the averaged ChIP Seq tags for H3K4me3 (top panels), H3Ac (middle panels) and pol II (bottom panels) in Ramos cells. Data from active target genes (STAT6 binding plus TSS induction in Ramos cells) are shown in the left panels, and data from silent target genes (STAT6 binding plus TSS induction in BEAS2B cells but both negative in Ramos cells) are shown in the right panels. Blue, green, red and purple lines indicate the results for the IP (IL-4 (+)), IP (IL-4 (−)), WCE (IL-4 (+)) and WCE (IL-4 (−)) experiments, respectively. On the x-axis, the position of the associated TSS is designated as zero. (B) Results of an analysis similar to that shown in (A) in BEAS2B cells.
Figure 4.
Figure 4.
Distinct regulation of STAT6 targets in different cell types. (A) Fold change of TF genes in response to IL-4 stimulation in Ramos cells (red bar) and BEAS2B cells (blue bar) evaluated by digital TSS-tag counts. TFs were ordered by their fold induction in Ramos cells on the x-axis. (B) Schematic representation of a model for distinct STAT6 activation in Ramos cells (upper panels) and BEAS2B cells (lower panels). Inferred chromatin status and pol II binding are shown for the active targets in the left panel and for the silent targets in the right panel. Green circles, STAT6; purple circles, pol II; yellow and orange circles, putative additional factors in Ramos and BEAS2B cells, respectively; left and right columns, active and silent chromatin, respectively.

Similar articles

Cited by

References

    1. Kaplan M.H., Schindler U., Smiley S.T., Grusby M.J. Stat6 is required for mediating responses to IL-4 and for development of Th2 cells. Immunity. 1996;4:313–19. - PubMed
    1. Ikizawa K., Kajiwara K., Koshio T., Matsuura N., Yanagihara Y. Inhibition of IL-4 receptor up-regulation on B cells by antisense oligodeoxynucleotide suppresses IL-4-induced human IgE production. Clin. Exp. Immunol. 1995;100:383–89. - PMC - PubMed
    1. Renauld J.C. New insights into the role of cytokines in asthma. J. Clin. Pathol. 2001;54:577–89. - PMC - PubMed
    1. Shirakawa I., Deichmann K.A., Izuhara I., Mao I., Adra C.N., Hopkin J.M. Atopy and asthma: genetic variants of IL-4 and IL-13 signalling. Immunol. Today. 2000;21:60–4. - PubMed
    1. Kuperman D.A., Schleimer R.P. Interleukin-4, interleukin-13, signal transducer and activator of transcription factor 6, and allergic asthma. Curr. Mol. Med. 2008;8:384–92. - PMC - PubMed

Publication types