. 2011 Sep;138(17):3657-66.
doi: 10.1242/dev.068858.

Effective fiber hypertrophy in satellite cell-depleted skeletal muscle

Affiliations

Effective fiber hypertrophy in satellite cell-depleted skeletal muscle

John J McCarthy et al. Development. 2011 Sep.

Abstract

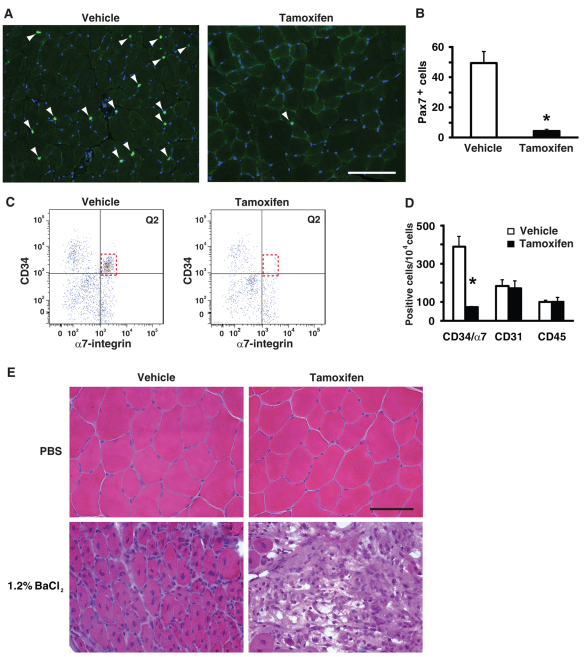
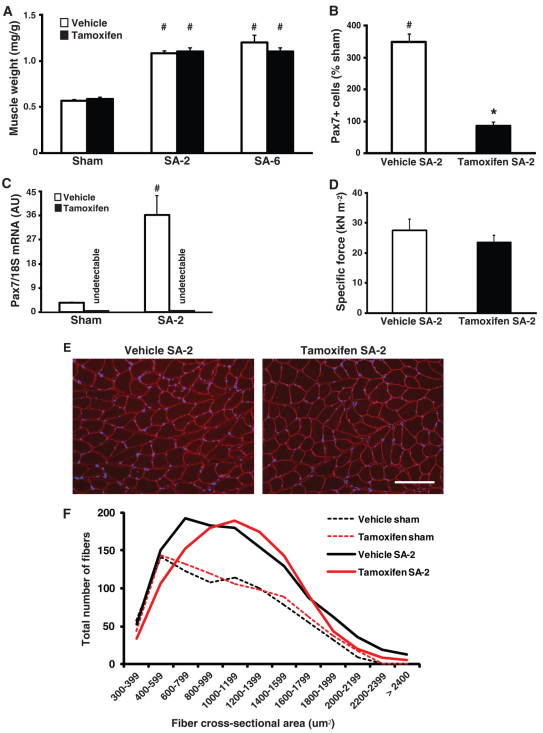
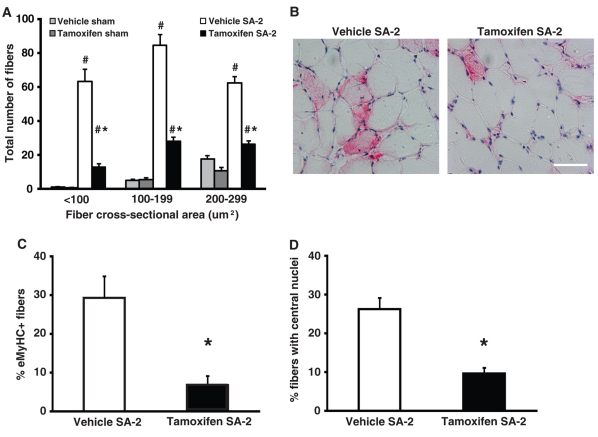
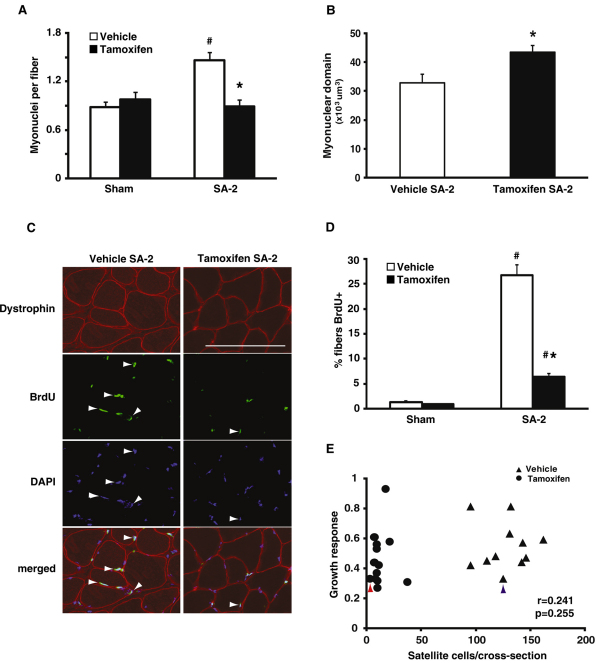
An important unresolved question in skeletal muscle plasticity is whether satellite cells are necessary for muscle fiber hypertrophy. To address this issue, a novel mouse strain (Pax7-DTA) was created which enabled the conditional ablation of >90% of satellite cells in mature skeletal muscle following tamoxifen administration. To test the hypothesis that satellite cells are necessary for skeletal muscle hypertrophy, the plantaris muscle of adult Pax7-DTA mice was subjected to mechanical overload by surgical removal of the synergist muscle. Following two weeks of overload, satellite cell-depleted muscle showed the same increases in muscle mass (approximately twofold) and fiber cross-sectional area with hypertrophy as observed in the vehicle-treated group. The typical increase in myonuclei with hypertrophy was absent in satellite cell-depleted fibers, resulting in expansion of the myonuclear domain. Consistent with lack of nuclear addition to enlarged fibers, long-term BrdU labeling showed a significant reduction in the number of BrdU-positive myonuclei in satellite cell-depleted muscle compared with vehicle-treated muscle. Single fiber functional analyses showed no difference in specific force, Ca(2+) sensitivity, rate of cross-bridge cycling and cooperativity between hypertrophied fibers from vehicle and tamoxifen-treated groups. Although a small component of the hypertrophic response, both fiber hyperplasia and regeneration were significantly blunted following satellite cell depletion, indicating a distinct requirement for satellite cells during these processes. These results provide convincing evidence that skeletal muscle fibers are capable of mounting a robust hypertrophic response to mechanical overload that is not dependent on satellite cells.


Figures

Fig. 1.
Fig. 1.
Conditional ablation of satellite cells in adult skeletal muscle. (A) Pax7 immunohistochemistry (IHC) was performed on gastrocnemius muscle from vehicle and tamoxifen-treated Pax7-DTA mice to identify satellite cell nuclei (green). Sections were counterstained with DAPI (blue) and Pax7+/DAPI+ nuclei (white arrowhead) were counted. Scale bar: 100 μm. (B) Quantification of Pax7+/DAPI+ nuclei showed >90% (range 84-98%) ablation of satellite cells in tamoxifen-treated muscle compared with vehicle-treated muscle (vehicle, 49.2±5.0 vs tamoxifen, 4.70±0.5 satellite cells/muscle cross-section; n=10/treatment). (C) Fluorescence-activated cell sorting (FACS) analysis revealed depletion of CD34+/α7-integrin+/CD31/CD45 cells in tamoxifen-treated group relative to vehicle (compare red dotted box in Q2). (D) Quantification of FACS analysis showed >80% loss of satellite cells (CD34+/α7-integrin+/CD31/CD45) in tamoxifen-treated muscle relative to vehicle-treated muscle (vehicle, 392±52 vs tamoxifen, 70±5 cells/10,000 cells; n=4/treatment) with no change in immunohematopoietic (CD45+) or endothelial (CD31+) cell profiles. (E) The tibialis anterior muscle was severely damaged by 1.2% BaCl2 injection and allowed to regenerate for seven days. Hematoxylin and Eosin (H&E) staining showed successful regeneration in vehicle-treated muscle, as indicated by distinct myofibers with centrally located nuclei, whereas tamoxifen-treated muscle depleted of satellite cells failed to regenerate. Scale bar: 50 μm. Values are presented as mean ± s.e.m. with significant difference (P<0.05) between vehicle and tamoxifen groups designated by an asterisk.
Fig. 2.
Fig. 2.
Robust hypertrophy in satellite cell-depleted plantaris muscle. (A) Normalized muscle weight (muscle weight/body weight, mg/g) increased approximately twofold in both SA-2 and SA-6 groups relative to their respective sham control. (B) In response to SA-2, Pax7 immunohistochemistry (IHC) showed that satellite cell abundance, relative to sham control, increased by 360% in vehicle-treated muscle but remained unchanged in tamoxifen-treated muscle. (C) As measured by real-time RT PCR, Pax7 mRNA expression increased by ∼15-fold in vehicle SA-2 muscle relative to sham control but was undetectable in tamoxifen sham and SA-2 groups, consistent with ablation of satellite cells. (D) Single fiber mechanics revealed no difference in maximum isometric force normalized to fiber cross-sectional area (specific force) between SA-2 groups (n=12/group). (E) Dystrophin IHC (red) to visualize the cell membrane showed no difference between SA-2 groups in gross fiber morphology. Scale bar:100 μm. (F) Line graph of fiber cross-sectional area distribution shows a rightward shift in SA-2 groups relative to respective sham controls, indicating a significant increase in the number of fibers with cross-sectional area of 600-1400 μm2 (see Fig. S2E in the supplementary material for bar graph). Values are presented as mean ± s.e.m. with significant difference (P<0.05) between sham and SA-2 groups indicated by a hash and significant difference between SA-2 groups indicated by an asterisk.
Fig. 3.
Fig. 3.
Regeneration is blunted in satellite cell-depleted plantaris muscle. (A) The total number of small fibers (<300 μm2) increased by approximately eightfold in vehicle SA-2 group but was significantly reduced in tamoxifen SA-2 relative to respective sham control (n=6-8/group). (B,C) Embryonic myosin expression (pink) was observed in 29% of vehicle SA-2 fibers and was significantly reduced to 7% of the fibers in tamoxifen SA-2 (n=4-5/group). Scale bar: 50 μm. (D) The number of fibers with centrally located nuclei was reduced from 26% in vehicle SA-2 to 10% in tamoxifen SA-2 (n=4-5/group). Values are presented as mean ± s.e.m. with significant difference (P<0.05) between sham and SA-2 groups indicated by a hash and significant difference between SA-2 groups indicated by an asterisk.
Fig. 4.
Fig. 4.
Skeletal muscle hypertrophy is independent of myonuclear accretion. (A) Dystrophin immunohistochemistry (IHC) and DAPI staining were performed and DAPI+ nuclei residing within the dystrophin antibody-stained sarcolemma were counted as myonuclei. The number of myonuclei increased by 63% in vehicle-treated SA-2 but remained unchanged in tamoxifen SA-2 relative to respective sham control (n=8/group). (B) DAPI+ nuclei were counted in fixed single fibers isolated from vehicle- and tamoxifen-treated SA-2 muscles and myonuclear domain size was calculated. Myonuclear domain increased by 32% in tamoxifen SA-2 fibers compared with fibers isolated from vehicle-treated muscle. (C) Location of nuclei that had incorporated BrdU was determined in vehicle- and tamoxifen-treated SA-2 muscle sections by double IHC with dystrophin (red) and BrdU (green) antibodies and DAPI staining (blue). BrdU+/DAPI+ myonuclei residing within the sarcolemma (white arrowheads) were counted. Scale bar: 50 μm. (D) Nearly 30% of muscle fibers contained a BrdU+ nucleus in vehicle SA-2,compared with ∼1% in sham control, which was reduced significantly to 6% in tamoxifen SA-2 (n=4/group). (E) There was no correlation (r=0.241, P=0.255) between satellite cell abundance and growth response (change in normalized muscle weight in response to synergist ablation) as highlighted by the similar growth response in muscle in which 98% of the satellite cells have been ablated (solid circle with red arrowhead) and muscle with all of its satellite cells present (solid triangle with blue arrowhead). Values are presented as mean ± s.e.m. with significant difference (P<0.05) between sham and SA-2 groups indicated by a hash and significant difference between SA-2 groups indicated by an asterisk.

References

    1. Adams G. R., Caiozzo V. J., Haddad F., Baldwin K. M. (2002). Cellular and molecular responses to increased skeletal muscle loading after irradiation. Am. J. Physiol. Cell Physiol. 283, C1182-C1195 - PubMed
    1. Akiho M., Nakashima H., Sakata M., Yamasa Y., Yamaguchi A., Sakuma K. (2010). Expression profile of Notch-1 in mechanically overloaded plantaris muscle of mice. Life Sci. 86, 59-65 - PubMed
    1. Amthor H., Otto A., Vulin A., Rochat A., Dumonceaux J., Garcia L., Mouisel E., Hourde C., Macharia R., Friedrichs M., et al. (2009). Muscle hypertrophy driven by myostatin blockade does not require stem/precursor-cell activity. Proc. Natl. Acad. Sci. USA 106, 7479-7484 - PMC - PubMed
    1. Arnold L., Henry A., Poron F., Baba-Amer Y., van Rooijen N., Plonquet A., Gherardi R. K., Chazaud B. (2007). Inflammatory monocytes recruited after skeletal muscle injury switch into antiinflammatory macrophages to support myogenesis. J. Exp. Med. 204, 1057-1069 - PMC - PubMed
    1. Blaauw B., Canato M., Agatea L., Toniolo L., Mammucari C., Masiero E., Abraham R., Sandri M., Schiaffino S., Reggiani C. (2009). Inducible activation of Akt increases skeletal muscle mass and force without satellite cell activation. FASEB J. 23, 3896-3905 - PubMed

Publication types