. 2011 Sep 29;118(13):3684-93.
doi: 10.1182/blood-2011-03-341446. Epub 2011 Aug 9.

Role of ZBP-89 in human globin gene regulation and erythroid differentiation

Affiliations

Role of ZBP-89 in human globin gene regulation and erythroid differentiation

Andrew J Woo et al. Blood. .

Abstract

The molecular mechanisms underlying erythroid-specific gene regulation remain incompletely understood. Closely spaced binding sites for GATA, NF-E2/maf, and CACCC interacting transcription factors play functionally important roles in globin and other erythroid-specific gene expression. We and others recently identified the CACCC-binding transcription factor ZBP-89 as a novel GATA-1 and NF-E2/mafK interacting partner. Here, we examined the role of ZBP-89 in human globin gene regulation and erythroid maturation using a primary CD34(+) cell ex vivo differentiation system. We show that ZBP-89 protein levels rise dramatically during human erythroid differentiation and that ZBP-89 occupies key cis-regulatory elements within the globin and other erythroid gene loci. ZBP-89 binding correlates strongly with RNA Pol II occupancy, active histone marks, and high-level gene expression. ZBP-89 physically associates with the histone acetyltransferases p300 and Gcn5/Trrap, and occupies common sites with Gcn5 within the human globin loci. Lentiviral short hairpin RNAs knockdown of ZBP-89 results in reduced Gcn5 occupancy, decreased acetylated histone 3 levels, lower globin and erythroid-specific gene expression, and impaired erythroid maturation. Addition of the histone deacetylase inhibitor valproic acid partially reverses the reduced globin gene expression. These findings reveal an activating role for ZBP-89 in human globin gene regulation and erythroid differentiation.


Figures
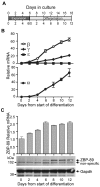
Figure 1
Figure 1
ZBP-89 expression during erythroid ex vivo differentiation of human CD34+ cells. (A) Schematic diagram showing time course of culture system used in the experiments. The days of total culture are indicated on top, and days of the individual expansion and differentiation periods are indicated separately on the bottom. (B) Time course of β-, γ-, ϵ-, and α-globin mRNA transcript levels after placing the expanded CD34+ cells into erythroid differentiation medium (“Cell culture”). Measurements were made by quantitative RT-PCR and are graphed relative to Gapdh mRNA levels at each time point ± SEM (n > 3). (C) Time course of ZBP-89 mRNA (top) and protein (bottom) levels along the same time course as shown in panel B. mRNA levels are shown relative to those on day 0 of the differentiation culture phase.
Figure 2
Figure 2
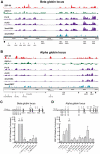
ZBP-89 occupancy of the globin loci in primary human erythroid precursor cells. Representative ChIP-chip signals for ZBP-89, GATA-1, RNA Pol II, AcH3, 3meH3K4, and 3meH3K27 within the human β-globin (A) and α-globin (B) loci in hCD34+ cells harvested on day 5 of the erythroid differentiation culture period. The locations of key cis-regulatory elements and genes are indicated at the bottom of each panel. The data for GATA-1, Pol II, 3meH3K4, and 3meH3K27 were obtained from Xu et al. (C-D) Quantitative ChIP validation of key ZBP-89 enrichment peaks from the ENCODE array ChIP-chip studies within the β-globin (C) and α-globin (D) loci from cells on day 6 of differentiation. The positions of the primers used for each site (numbered) are indicated by horizontal lines at the top of the schematic drawing. Note that the primers used for the HBG promoters (#4) detect both HBG1 and HBG2. Likewise, the primers for the HBA promoters (#10) detect both HBA1 and HBA2 promoters. It was not possible to design primers centered at the peak of the ZBP-89 enrichment site between HBG1 and HBD (A) because of high GC content of this region. Primer pair #5 is offset from the center of the peak. Fold enrichments are shown relative to an exonic region of the β-actin gene. Data represent the mean of ≥ 3 independent experiments ± SEM.
Figure 3
Figure 3
Association of ZBP-89 chromatin occupancy with activating gene features. (A) DNA sequence motif preference at ZBP-89 bound sites across the entire ENCODE array using cis-regulatory element annotation system algorithm. (B) Pie chart showing the relative location of ZBP-89 occupancy peaks relative to annotated gene structures. (C) Venn diagram showing overlap of genes containing ZBP-89 occupancy peaks and those with enrichment for 3meH3K4 and/or 3meH3K27 between −2 kb upstream to 2 kb downstream of the TSS. (D) Venn diagram showing overlap of ZBP-89 occupied genes, RNA Pol II-occupied genes, and genes enriched for AcH3. (E) Plot showing percentage frequency of ZBP-89, RNA Pol II, AcH3, 3meH3K4, and 3meH3K27 enrichment peaks relative to distance from the TSS. (F) Plots of normalized cDNA gene expression microarray probe intensity signals (NCBI GEO accession no. GSE22552) corresponding to the 84 ZBP-89 bound genes (represented by 219 probes; red) compared with the mean of 10 sets of randomly selected 219 probe sets (blue). Data for each of the represented equivalent erythroid maturational stages (CFU-E), proerythroblast (Pro-E), intermediate erythroblast (Int-E), and late erythroblast (Late-E) are shown. All probe sets to the left of the vertical arrows have intensities ≥ 1.5-fold greater than the random control probe sets of equivalent rank order.
Figure 4
Figure 4
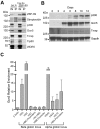
Physical association of p300 and the Gcn5/Trrap (GNAP) complex with ZBP-89 in human erythroid cells. (A) Tandem anti-FLAG, streptavidin affinity purification assay from uninduced K562 cells stably expressing FLAG and metabolically biotin tagged ZBP-89 (FLAG-Bio ZBP89) versus control cells expressing birA alone. Western blot analysis of the final copurified proteins for the indicated proteins is shown. Streptavidin indicates streptavidin-horseradish peroxidase (SA-HRP) direct blot; IN′, 2% input; and IP, streptavidin affinity purified material. (B) Western blot analysis of indicated proteins during erythroid commitment and maturation from expanded CD34+ cells. Time represents days after the cells were switched into differentiation medium. (C) Quantitative ChIP assays for Gcn5 occupancy at key cis-regulatory regions within the β- and α-globin loci from cells on day 7 of differentiation. Fold enrichments are shown relative to an exonic region of the β-actin gene. Data represent the mean of 3 independent experiments ± SEM.
Figure 5
Figure 5
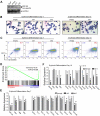
Requirement for ZBP-89 in human globin gene activation and erythroid maturation. (A) Lentiviral-mediated shRNA knockdown of ZBP-89 in ex vivo differentiated erythroid precursors. Western blot for ZBP-89 protein levels in nontransduced erythroid precursors (EryP), or those transduced with the empty lentiviral vector or vectors containing one of 2 shRNA constructs (sh1 and sh2) that target different sequences within ZBP-89 exon 9 (“shRNA knockdown”). Western blot was performed from cells harvested on day 7 after placement into differentiation medium. (B) May-Grunwald-Giemsa stains of cytospun EryP cells transduced with the empty vector, sh1 or sh2 on days 7 and 10 of differentiation (original magnification × 600; see supplemental Figure 2 for additional images). (C) Flow cytometric analysis for CD71 and CD235a expression of EryP cells transduced with the empty vector, sh1, or sh2 on days 7 and 10 of differentiation. (D) Gene Set Enrichment Analysis of genes differentially expressed on ZBP-89 knockdown (sh1; vs the empty vector) on day 6 of differentiation compared with the erythroid-specific expressed gene set. The y-axis shows the enrichment score for each gene, which is illustrated as a vertical line plotted in rank order of most up regulated (left) to most down-regulated (right). (E-F) Quantitative RT-PCR analysis of mRNA transcript levels for the indicated genes in EryP cells transduced with the empty vector, sh1, or sh2 on day 7 (E) and day 10 (F) of differentiation. Expression is shown relative to levels from the empty vector-transduced cells and is normalized to Gapdh levels. Measurements represent the mean from > 3 independent experiments ± SEM. *Significant differences compared with the empty vector (P < .05, Student t test).
Figure 6
Figure 6
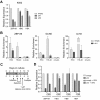
Role of ZBP-89 in globin gene regulation and recruitment of HATs. (A) Change in globin gene expression on ZBP-89 depletion in uninduced K562 cells. Relative mRNA levels for ZBP-89, HBG (γ-globin), and HBA (α-globin) normalized to Gapdh are shown in uninduced K562 cells transduced with either the empty vector, or ZBP-89 sh1 and sh2. Levels are shown relative to the empty vector control and represent the mean of 3 independent experiments ± SEM. (B) Quantitative ChIP assays for ZBP-89, Gcn5, and AcH3 enrichment levels at β-globin HS3 and α-globin HS-40 in human EryP cells transduced with the empty vector or ZBP-89 sh1. The cells were harvested on day 6 of differentiation. The data represent the enrichment relative to β-actin exon 6 and are the mean of 2 biologic duplicates and 3 experimental repeats ± SEM. (D) Effect of VPA on globin gene expression changes induced by ZBP-89 depletion. Relative mRNA levels for ZBP-89, HBG (γ-globin), HBB (β-globin), and HBA (α-globin) in human EryP cells transduced with the empty vector or ZBP-89 sh1. Transduced and selected cells were divided into 2 cultures and incubated with either 1μM VPA in PBS or PBS alone. Cells were harvested 72 hours later. Levels are shown relative to the empty vector control and represent the mean of 3 experiments ± SEM.

References

    1. Weatherall DJ. The inherited diseases of hemoglobin are an emerging global health burden. Blood. 2010;115(22):4331–4336. - PMC - PubMed
    1. Jamison DT, editor. Priorities in Health. Washington, DC: World Bank Group; 2006.
    1. Harju S, McQueen KJ, Peterson KR. Chromatin structure and control of β-like globin gene switching. Exp Biol Med. 2002;227(9):683–700. - PubMed
    1. Ikuta T, Papayannopoulou T, Stamatoyannopoulos G, Kan YW. Globin gene switching: in vivo protein-DNA interactions of the human beta-globin locus in erythroid cells expressing the fetal or the adult globin gene program. J Biol Chem. 1996;271(24):14082–14091. - PubMed
    1. Donze D, Townes TM, Bieker JJ. Role of erythroid Kruppel-like factor in human gamma- to beta-globin gene switching. J Biol Chem. 1995;270(4):1955–1959. - PubMed

Publication types

MeSH terms