. 2011 Oct 27;118(17):4646-56.
doi: 10.1182/blood-2011-03-343947. Epub 2011 Aug 9.

Cell of origin strongly influences genetic selection in a mouse model of T-ALL

Affiliations

Cell of origin strongly influences genetic selection in a mouse model of T-ALL

Katherine E Berquam-Vrieze et al. Blood. .

Abstract

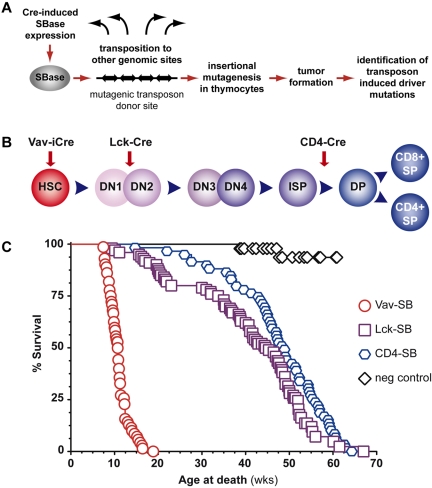
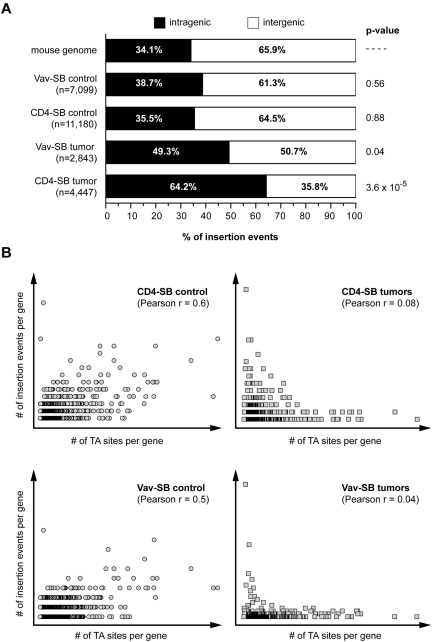
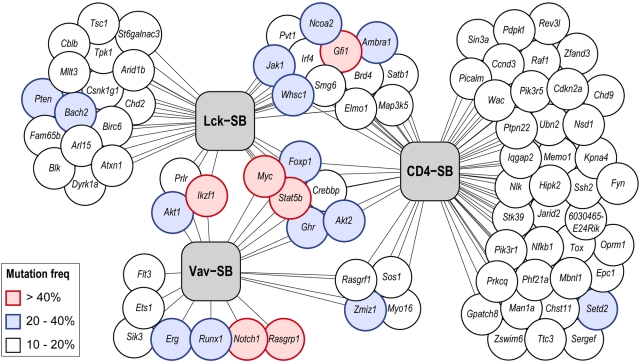
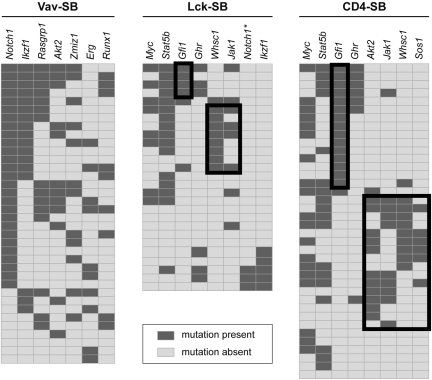
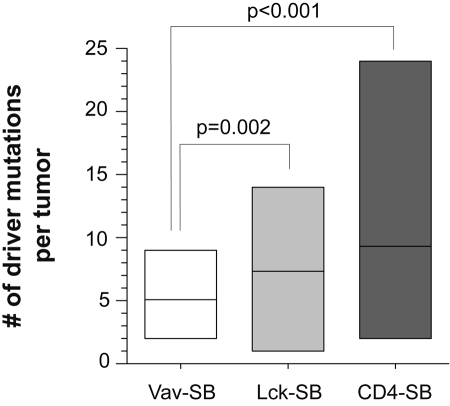
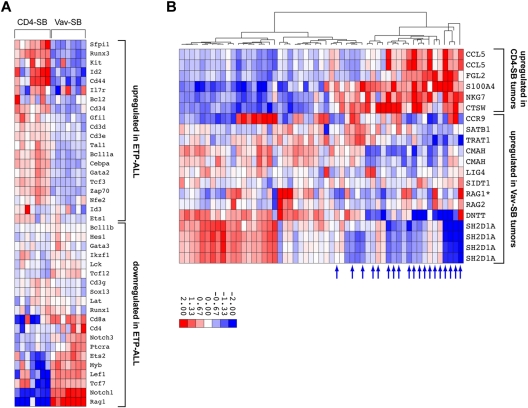
Identifying the normal cell from which a tumor originates is crucial to understanding the etiology of that cancer. However, retrospective identification of the cell of origin in cancer is challenging because of the accumulation of genetic and epigenetic changes in tumor cells. The biologic state of the cell of origin likely influences the genetic events that drive transformation. We directly tested this hypothesis by performing a Sleeping Beauty transposon mutagenesis screen in which common insertion sites were identified in tumors that were produced by mutagenesis of cells at varying time points throughout the T lineage. Mutation and gene expression data derived from these tumors were then compared with data obtained from a panel of 84 human T-cell acute lymphoblastic leukemia samples, including copy number alterations and gene expression profiles. This revealed that altering the cell of origin produces tumors that model distinct subtypes of human T-cell acute lymphoblastic leukemia, suggesting that even subtle changes in the cell of origin dramatically affect genetic selection in tumors. These findings have broad implications for the genetic analysis of human cancers as well as the production of mouse models of cancer.


Figures

Figure 1
Figure 1
Sleeping Beauty (SB)–induced models of T-cell lymphoma that initiate at distinct developmental time points. (A) An overview of the SB mutagenesis screen to identify driver mutations is shown. (B) Three different Cre-transgenic strains were used to induce SB transposase expression, and thus transposon mutagenesis, at distinct stages of differentiation. (C) A Mantel-Cox log-rank test indicated showed that tumor latency varied significantly between all 3 models (Vav-SB vs Lck-SB [P < .0001], Vav-SB vs CD4-SV [P < .001], Lck-SB vs CD4-SB [P = .026]). Tumors developed rapidly in the Vav-SB model (avg = 11 weeks), but much more slowly in the Lck-SB (avg = 45 weeks) and CD4-SB (avg = 49 weeks) models. DN indicates CD4/CD8 double-negative; ISP, immature single positive; and DP = CD4/CD8 double positive.
Figure 2
Figure 2
Transposition within the T-cell lineage does not show significant integration site bias. (A) The distribution of insertion sites within nonmalignant thymocytes and tumors from the Vav-SB and CD4-SB models is shown. A Fisher exact test was used to compare the distribution in each sample to the expected distribution observed in the mouse genome. (B) A Pearson correlation revealed a positive correlation between the number of insertion events within each RefSeq gene and the number of TA sites (ie, SB target sites) found within the gene. However, this correlation is present in nonmalignant control samples (circles) but not in tumor samples (squares).
Figure 3
Figure 3
Distribution of driver mutations in 3 independent SB models of T-ALL. Each gene identified as a driver mutation in one or more models is represented as a circle. The connecting lines indicate each gene's association with one or more T-ALL models (represented by gray boxes). The frequency of transposon-induced mutation in each gene is indicated by its color (white, 10%-20%; blue, 20%-40%; red, > 40%). In cases where a gene was identified in multiple models, the highest mutation frequency is indicated.
Figure 4
Figure 4
Identification of genetic signatures within each T-ALL model. Genetic signatures were identified within each model by identifying mutations that show significant negative correlation. For each panel, genes are shown as columns as indicated across the top, and individual tumors are shown as independent rows. A dark gray box indicates the presence of a transposon insertion within the indicated gene while a light gray box implies the absence of mutation. Negative correlation between pairs of genes were assessed by Fisher exact test. Black-lined boxes indicate subsets of tumors defined by a negative correlation. For example, mutations in Gfi1 were mutually exclusive with mutations in Whsc1 (P = .018), Akt2 (P = .004), Jak1 (P = .018), and Sos1 (P = .027) in CD4-SB tumors. *Insertion events detected, but below threshold for significance.
Figure 5
Figure 5
The number of driver mutations in each tumor is indicated for each of the 3 tumor models. The average number of driver mutations differed significantly across the models. A t test was performed to compare the differences between each pair of models. No significant difference was observed between Lck-SB and CD4-SB tumors.
Figure 6
Figure 6
Comparative oncogenomics of SB-induced T-cell lymphomas. (A) Global gene expression was analyzed in a set of 7 Vav-SB and 7 CD4-SB tumors. Unsupervised clustering analysis was performed using expression data from a set of 40 genes that distinguished typical T-ALL from ETP-ALL. (B) Global gene expression analysis identified 2 gene sets that were up-regulated in either Vav-SB or CD4-SB tumors. Gene-set enrichment analysis showed that genes up-regulated in CD4-SB are enriched in ETP-ALL samples (blue arrows) while the Vav-SB gene set is enriched in typical T-ALL samples.
Figure 7
Figure 7
Summary showing the effect of cell of origin on lymphomagenesis. Despite that transposon mutagenesis in Vav-SB mice occurs at all stages of T-cell development, lymphomas that develop in these mice are driven by a largely nonoverlapping set of mutations compared with lymphomas from CD4-SB mice (Table 2). A proposed model is shown to explain the significant differences in these models of T-cell lymphoma.

Comment in

References

    1. Barker N, Ridgway RA, van Es JH, et al. Crypt stem cells as the cells-of-origin of intestinal cancer. Nature. 2009;457(7229):608–611. - PubMed
    1. Chen W, Kumar AR, Hudson WA, et al. Malignant transformation initiated by Mll-AF9: gene dosage and critical target cells. Cancer Cell. 2008;13(5):432–440. - PMC - PubMed
    1. Yang ZJ, Ellis T, Markant SL, et al. Medulloblastoma can be initiated by deletion of patched in lineage-restricted progenitors or stem cells. Cancer Cell. 2008;14(2):135–145. - PMC - PubMed
    1. Dupuy AJ, Rogers LM, Kim J, et al. A modified Sleeping Beauty transposon system that can be used to model a wide variety of human cancers in mice. Cancer Res. 2009;69(20):8150–8156. - PMC - PubMed
    1. Dupuy AJ, Akagi K, Largaespada DA, Copeland NG, Jenkins NA. Mammalian mutagenesis using a highly mobile somatic Sleeping Beauty transposon system. Nature. 2005;436(7048):221–226. - PubMed

Publication types

MeSH terms

Substances