. 2011 Aug 9;2(4):e00169-11.
doi: 10.1128/mBio.00169-11. Print 2011.

Type 1 interferon induction of natural killer cell gamma interferon production for defense during lymphocytic choriomeningitis virus infection

Affiliations

Type 1 interferon induction of natural killer cell gamma interferon production for defense during lymphocytic choriomeningitis virus infection

Ethan A Mack et al. mBio. .

Abstract

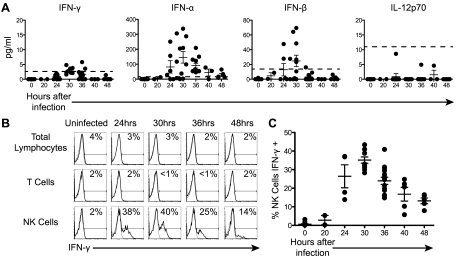
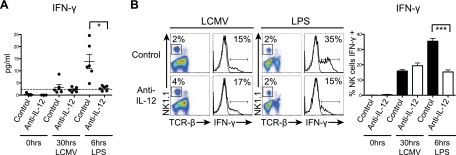
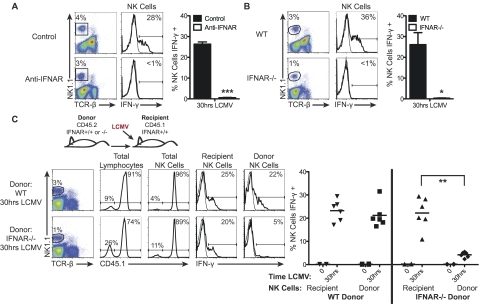
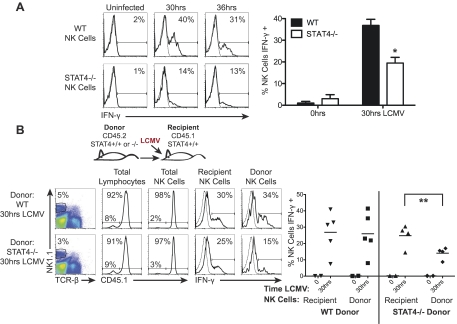
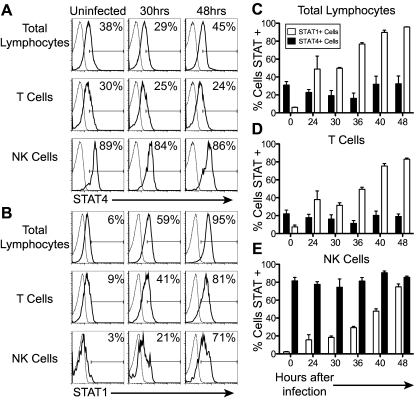
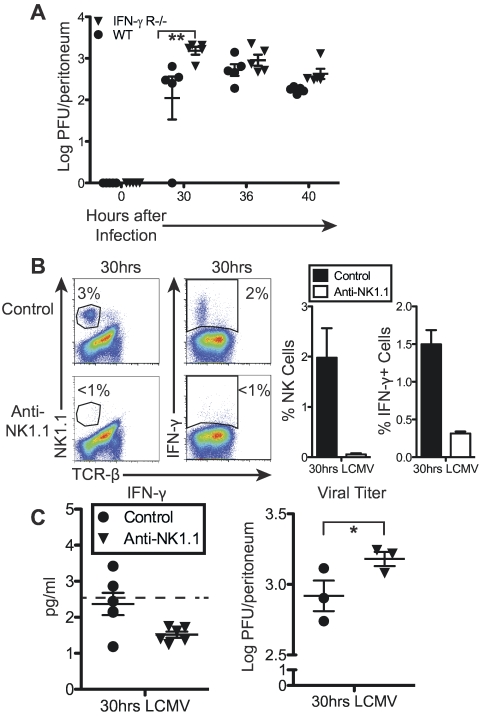
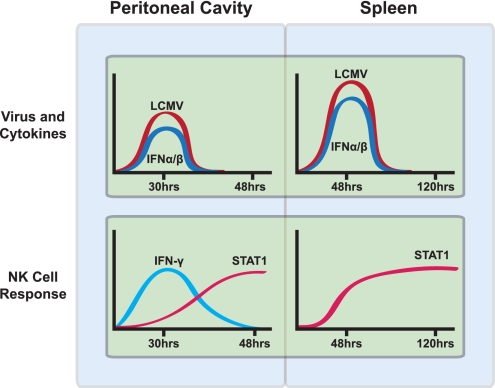
Natural killer (NK) cells are equipped to innately produce the cytokine gamma interferon (IFN-γ) in part because they basally express high levels of the signal transducer and activator of transcription 4 (STAT4). Type 1 interferons (IFNs) have the potential to activate STAT4 and promote IFN-γ expression, but concurrent induction of elevated STAT1 negatively regulates access to the pathway. As a consequence, it has been difficult to detect type 1 IFN stimulation of NK cell IFN-γ during viral infections in the presence of STAT1 and to understand the evolutionary advantage for maintaining the pathway. The studies reported here evaluated NK cell responses following infections with lymphocytic choriomeningitis virus (LCMV) in the compartment handling the earliest events after infection, the peritoneal cavity. The production of type 1 IFNs, both IFN-α and IFN-β, was shown to be early and of short duration, peaking at 30 h after challenge. NK cell IFN-γ expression was detected with overlapping kinetics and required activating signals delivered through type 1 IFN receptors and STAT4. It took place under conditions of high STAT4 levels but preceded elevated STAT1 expression in NK cells. The IFN-γ response reduced viral burdens. Interestingly, increases in STAT1 were delayed in NK cells compared to other peritoneal exudate cell (PEC) populations. Taken together, the studies demonstrate a novel mechanism for stimulating IFN-γ production and elucidate a biological role for type 1 IFN access to STAT4 in NK cells.

Importance: Pathways regulating the complex and sometimes paradoxical effects of cytokines are poorly understood. Accumulating evidence indicates that the biological consequences of type 1 interferon (IFN) exposure are shaped by modifying the concentrations of particular STATs to change access to the different signaling molecules. The results of the experiments presented conclusively demonstrate that NK cell IFN-γ can be induced through type 1 IFN and STAT4 at the first site of infection during a period with high STAT4 but prior to induction of elevated STAT1 in the cells. The response mediates a role in viral defense. Thus, a very early pathway to and source of IFN-γ in evolving immune responses to infections are identified by this work. The information obtained helps resolve long-standing controversies and advances the understanding of mechanisms regulating key type 1 IFN functions, in different cells and compartments and at different times of infection, for accessing biologically important functions.


Figures

FIG 1
FIG 1
Cytokine expression in the peritoneal cavity during LCMV infection. C57BL/6 mice were uninfected (time 0) or infected i.p. with LCMV for the indicated times. Peritoneal lavage fluids and cells were collected. (A) Cytokine levels in lavage fluids were measured. IFN-γ and IL-12p70 levels were quantified by CBA, and IFN-α and IFN-β levels were quantified by ELISA. CBA data were pooled from six independent experiments with the following total numbers of individual samples: n =11 (time 0), 2 (20 h), 9 (24 h), 8 (30 h), 17 (36 h), 3 (40 h), and 5 (48 h). ELISA data were pooled from six independent experiments with total n = 11 (0 h), 2 (20 h), 6 (24 h) 11 (30 h), 11 (36 h), 3 (40 h), and 5 (48 h). (B and C) Flow cytometry was used to define subsets expressing intracellular IFN-γ. Cell surface staining of NK1.1 and TCR-β followed by cytoplasmic staining for IFN-γ expression was carried out. Analysis was based on subsets identified in an extended lymphocyte gate. (B) Representative cytoplasmic IFN-γ expression within total lymphocytes, T cells, and NK cells (solid black line) compared to isotype controls for staining (dashed black line). The numbers shown are percentages of IFN-γ-expressing cells. (C) Proportions of peritoneal NK cells expressing IFN-γ were evaluated by pooling results from eight independent experiments with total n = 13 (0 h), 2 (20 h), 4 (24 h), 10 (30 h), 15 (36 h), 5 (40 h), and 5 (48 h). Filled circles are results from individual animals. Bars are means ± standard errors of the means (SEM).
FIG 2
FIG 2
Effects of IL-12 blockade on peritoneal IFN-γ responses to LCMV or LPS. Mice were uninfected, infected with LCMV for 30 h, or treated with LPS at 6 h prior to harvest. They were administered anti-IL-12 or control antibodies 12 h prior to LCMV infection and 36 h prior to LPS treatment. Peritoneal lavage fluids and cells were harvested at the indicated times. (A) IFN-γ levels in the lavage fluids were determined by CBA. Each point represents an individual animal. (B) NK cell subsets were identified and examined for IFN-γ level expression by flow cytometry. Representative flow cytometric plots from individual animals are shown on the left, and a quantification of the data is shown in bar graphs on the right. Results presented for both panels are pooled from two independent experiments having groups each having n = 3. Means ± SEM are shown. *, P < 0.02; ***, P ≤ 0.0001.
FIG 3
FIG 3
Effects of type 1 IFN responsiveness on peritoneal NK cell IFN-γ expression. (A) Control or anti-IFNAR antibodies were administered to mice prior to LCMV infection, and NK cell IFN-γ expression was measured at 30 h after infection. Intracellular IFN-γ expression in single samples is shown on the left, and quantification of multiple samples is shown on the right. Data are representative of one independent experiment with n = 3. (B) NK cells were examined for IFN-γ expression at 30 h after LCMV infection of IFNAR−/− and WT mouse controls. Representative staining from single samples is presented on left. Data pooled from two independent experiments with n = 3 (WT) and 5 (IFNAR−/−) are presented on right. Bars are means ± SEM. (C) Adoptive transfer of peritoneal cells from IFNAR−/− and WT mice into WT mice followed by LCMV infection was performed to assess the requirement for type 1 IFN signaling within NK cells. Recipient cells were identified as CD45.1+ and donor cells were identified as CD45.1. The IFN-γ expression, in representative samples, by WT and IFNAR−/− peritoneal NK cells following adoptive transfer into WT mice at 30 h after LCMV infection is given on the left. Data pooled from two independent experiments with n = 4 (0 h) and 6 (30 h) are shown on right. Each point represents an individual animal. Bars are means ± SEM. *, P < 0.0005; **, P = 0.0001; ***, P ≤ 0.0001.
FIG 4
FIG 4
Effect of STAT4 loss on peritoneal NK cell IFN-γ expression. (A) Differences in the responses to LCMV infection were examined in WT and STAT4−/− mice. Representative IFN-γ expression in NK cells (solid black line) isolated from uninfected (0 h) and 30- and 36-h LCMV-infected mice compared to isotype controls (dashed black line) is given on the left. Shown is a quantification of IFN-γ expression in STAT4−/− peritoneal NK cells (white bars) compared to WT (black bars) results from multiple mice. Data are representative of two independent experiments with n = 3 (0 h and STAT4−/− at 30 h) and 2 (WT at 30 h). (B) Adoptive transfer of peritoneal cells from WT and STAT4−/− mice into WT mice followed by LCMV infection. Donor and recipient mice were congenic with cells from donor mice lacking CD45.1 (CD45.1) and from recipient mice expressing CD45.1 (CD45.1+). Representative IFN-γ expression by WT and STAT4−/− peritoneal NK cells (solid black line) during adoptive transfer into WT mice at 30 h after LCMV infection compared to isotype control (dashed black line) is presented on the left. Points on the right show results from individual mice collected from two independent experiments with n = 4 (0 h), 5 (30 h WT), and 4 (30 h STAT4−/−). Bars are means ± SEM. *, P < 0.05; **, P < 0.02.
FIG 5
FIG 5
STAT1 and STAT4 levels in peritoneal cells. Total intracellular STAT1 and STAT4 protein levels were measured by flow cytometry in peritoneal cells isolated at different times during LCMV infection of WT mice. Representative data of STAT4 (A) and STAT1 (B) expression at 0, 30, and 48 h after LCMV infection in single samples examining total lymphocytes, T cells, and NK cells (solid black line) are shown compared to isotype controls (dashed black line). Compiled data on the percentage of cells expressing STAT1 (open bars) and STAT4 (filled bars) (±SEM) at 0, 24, 20, 36, 40, and 48 h of LCMV infection are shown for total lymphocytes (C), T cells (D), and NK cells (E). Data are representative of three independent experiments, with different ranges of times for groups with n = 3.
FIG 6
FIG 6
Impact of peritoneal IFN-γ on LCMV viral burden. (A) Viral titers at different times of infection in the peritoneal cavity. Differences in LCMV titer in IFN-γR−/− compared to WT controls are shown. Data are from one independent experiment for groups with n = 5. Bars are means ± SEM. Results are representative of five different experiments with different numbers of samples at different times of infections. (B) NK cell depletion in the peritoneum. The consequences of control antibody compared to anti-NK1.1 treatments on NK cell numbers and IFN-γ-expressing cells at 30 h of LCMV infection are presented in the upper panel. Flow graphs show results from individual samples. Bar graphs give averages from three individual mice. (C) Peritoneal IFN-γ levels were measured in lavage fluids by CBA following control or anti-NK1.1 treatments. Data representative of two experiments with n = 6 (30 h) for each group in each experiment. Peritoneal viral titers were measured in a plaque assay. Data representative of three independent experiments with individual total samples for each group being n = 15. Each point represents an individual animal. Bars are means ± SEM. *, P = 0.05; **, P < 0.0002.
FIG 7
FIG 7
Compartmental differences in innate immune response to LCMV infection. Shown is a schematic representation of the differences in the immune response to LCMV in the peritoneal cavity compared to the spleen. The results presented here studying the peritoneal cavity show that both type 1 IFNs and the viral burden peak at 30 h. This is correlated with an early peak in IFN-γ production in NK cells. NK cell production of IFN-γ occurs before STAT1 levels have risen. Previous work with the spleen has shown that a more vigorous peak in viral load and type 1 IFNs is seen between 2 and 3 days after LCMV infection with a concurrent rise in STAT1 (7). Type 1 IFNs are unable to access STAT4-dependent IFN-γ production due to the earlier rise in STAT1 levels. The response in the peritoneum promotes antiviral defense. The response in the spleen protects from dysregulated cytokine production and cytokine-mediated disease.

References

    1. Biron CA, Nguyen KB, Pien GC, Cousens LP, Salazar-Mather TP. 1999. Natural killer cells in antiviral defense: function and regulation by innate cytokines. Annu. Rev. Immunol. 17:189–220 - PubMed
    1. Lee SH, Biron CA. 2010. Here today—not gone tomorrow: roles for activating receptors in sustaining NK cells during viral infections. Eur. J. Immunol. 40:923–932 - PMC - PubMed
    1. Orange JS, Biron CA. 1996. Characterization of early IL-12, IFN-alphabeta, and TNF effects on antiviral state and NK cell responses during murine cytomegalovirus infection. J. Immunol. 156:4746–4756 - PubMed
    1. Nguyen KB, et al. 2002. Coordinated and distinct roles for IFN-alpha beta, IL-12, and IL-15 regulation of NK cell responses to viral infection. J. Immunol. 169:4279–4287 - PubMed
    1. García-Sastre A, Biron CA. 2006. Type 1 interferons and the virus-host relationship: a lesson in detente. Science 312:879–882 - PubMed

Publication types

MeSH terms