. 2011 Aug;188(4):799-808.
doi: 10.1534/genetics.111.127324.

Genome evolution and meiotic maps by massively parallel DNA sequencing: spotted gar, an outgroup for the teleost genome duplication

Affiliations

Genome evolution and meiotic maps by massively parallel DNA sequencing: spotted gar, an outgroup for the teleost genome duplication

Angel Amores et al. Genetics. 2011 Aug.

Abstract

Genomic resources for hundreds of species of evolutionary, agricultural, economic, and medical importance are unavailable due to the expense of well-assembled genome sequences and difficulties with multigenerational studies. Teleost fish provide many models for human disease but possess anciently duplicated genomes that sometimes obfuscate connectivity. Genomic information representing a fish lineage that diverged before the teleost genome duplication (TGD) would provide an outgroup for exploring the mechanisms of evolution after whole-genome duplication. We exploited massively parallel DNA sequencing to develop meiotic maps with thrift and speed by genotyping F(1) offspring of a single female and a single male spotted gar (Lepisosteus oculatus) collected directly from nature utilizing only polymorphisms existing in these two wild individuals. Using Stacks, software that automates the calling of genotypes from polymorphisms assayed by Illumina sequencing, we constructed a map containing 8406 markers. RNA-seq on two map-cross larvae provided a reference transcriptome that identified nearly 1000 mapped protein-coding markers and allowed genome-wide analysis of conserved synteny. Results showed that the gar lineage diverged from teleosts before the TGD and its genome is organized more similarly to that of humans than teleosts. Thus, spotted gar provides a critical link between medical models in teleost fish, to which gar is biologically similar, and humans, to which gar is genomically similar. Application of our F(1) dense mapping strategy to species with no prior genome information promises to facilitate comparative genomics and provide a scaffold for ordering the numerous contigs arising from next generation genome sequencing.


Figures

Figure 1
Figure 1
Phylogenetic relationships among lobe-fin (Sarcopterygii) and ray-fin (Actinopterygii) fish (after Inoue et al. 2005; Benton and Donoghue 2007). Lineages of teleosts and gar diverged ∼340 million years ago (MYA) and lineages of ray-fin fish and tetrapods separated ∼440 MYA. Species: human (Homo sapiens), chicken (Gallus gallus), bichir (Polypterus ornatipinnis), spotted gar (Lepisosteus oculatus), bowfin (Amia calva), goldeye (Hiodon alosoides), zebrafish (Danio rerio), trout (Oncorhynchus mykiss), and stickleback (Gasterosteus aculatus).
Figure 2
Figure 2
Generating a RAD-tag genetic map. (A) Markers heterozygous in one parent and homozygous in the other (A in the male and B in the female) map as a backcross. Markers heterozygous in both parents with one shared allele (C) associate sex-specific maps into a combined map. (B) Digesting DNA with a restriction enzyme and sequencing in both directions from the cut site yields RAD tags. (C) Stacks software sorts tags into stacks of identical sequences. (D) Comparing stacks pairwise joins stacks into loci that differ at fewer than three nt. (E) Errors are sporadic, but alleles are identified statistically when two alternative nucleotides at a single position are each present in a significant number of reads. (F) Marker number varied among the 29 linkage groups (red columns, scale on the left), as did the number of coding markers (right scale), including ESTs (green), paired-end reads (blue), and RAD tags in coding regions (purple). (G) Linkage group Loc15 from the combined map showing 145 mapped markers, 34 of which are coding (red).
Figure 3
Figure 3
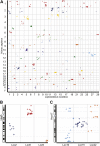
Comparative genomics of gar and human. (A) Oxford grid comparing human (Homo sapiens) and gar (Lepisosteus oculatus) genomes. Each symbol represents the position of an orthologous pair of genes in each genome. (B) Different portions of human chromosome 5 (Hsa5) correspond to nonoverlapping parts of different gar chromosomes (Loc2, Loc6, and Loc9). (C) Different portions of Hsa17 correspond to nonoverlapping parts of different gar chromosomes (Loc10, Loc15, and Loc22).
Figure 4
Figure 4
Comparative genomics of gar and teleosts. (A) Oxford grid comparing stickleback (Gasterosteus aculeatus) and gar (Lepisosteus oculatus) genomes. (B) Oxford grid comparing zebrafish (Danio rerio) and gar genomes. (C) Orthologs of Hsa17 genes were distributed on the upper portion of Loc10 but appeared on two different zebrafish chromosomes, Dre3 and Dre12, with duplicates of some genes occupying both zebrafish chromosomes.
Figure 5
Figure 5
Syntenic comparisons of two teleosts (zebrafish and stickleback) to gar and human. Branch lengths are proportional to conserved syntenies estimated by counting the average number of gar (or human) chromosomes containing orthologs of genes on a teleost chromosome divided by the number of chromosomes in gar (or human) normalized to divergence times in hundreds of millions of years (Table S2). Branch lengths between gar and human are much shorter than lengths between either of these two species and teleost genomes.

References

    1. Albertson R. C., Cresko W., Detrich H. W., 3rd, Postlethwait J. H., 2009. Evolutionary mutant models for human disease. Trends Genet. 25: 74–81 - PMC - PubMed
    1. Albertson R. C., Yan Y. L., Titus T. A., Pisano E., Vacchi M., et al. , 2010. Molecular pedomorphism underlies craniofacial skeletal evolution in Antarctic notothenioid fishes. BMC Evol. Biol. 10: 4. - PMC - PubMed
    1. Amores A., Force A., Yan Y. L., Joly L., Amemiya C., et al. , 1998. Zebrafish hox clusters and vertebrate genome evolution. Science 282: 1711–1714 - PubMed
    1. Baird N. A., Etter P. D., Atwood T. S., Currey M. C., Shiver A. L., et al. , 2008. Rapid SNP discovery and genetic mapping using sequenced RAD markers. PLoS ONE 3: e3376. - PMC - PubMed
    1. Benton M. J., Donoghue P. C., 2007. Paleontological evidence to date the tree of life. Mol. Biol. Evol. 24: 26–53 - PubMed

Publication types

MeSH terms