. 2011 Aug 9:2:417.
doi: 10.1038/ncomms1424.

Rhythmic actomyosin-driven contractions induced by sperm entry predict mammalian embryo viability

Affiliations

Rhythmic actomyosin-driven contractions induced by sperm entry predict mammalian embryo viability

Anna Ajduk et al. Nat Commun. .

Abstract

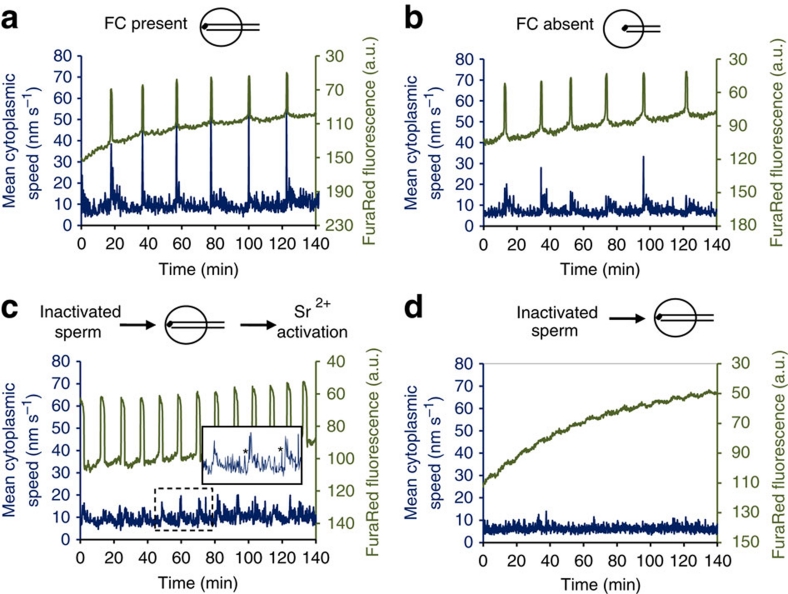
Fertilization-induced cytoplasmic flows are a conserved feature of eggs in many species. However, until now the importance of cytoplasmic flows for the development of mammalian embryos has been unknown. Here, by combining a rapid imaging of the freshly fertilized mouse egg with advanced image analysis based on particle image velocimetry, we show that fertilization induces rhythmical cytoplasmic movements that coincide with pulsations of the protrusion forming above the sperm head. We find that these movements are caused by contractions of the actomyosin cytoskeleton triggered by Ca(2+) oscillations induced by fertilization. Most importantly, the relationship between the movements and the events of egg activation makes it possible to use the movements alone to predict developmental potential of the zygote. In conclusion, this method offers, thus far, the earliest and fastest, non-invasive way to predict the viability of eggs fertilized in vitro and therefore can potentially improve greatly the prospects for IVF treatment.


Conflict of interest statement

A U.S. patent has been filed on this work. 'Methods for predicting mammalian embryo viability' (US application no. 61/503827).

Figures

Figure 1
Figure 1. Oscillations of cytoplasmic speed in fertilized mouse eggs.
(a) Schematic of the cross-correlation image analysis algorithm used to measure the movement of the cell cytoplasm (detailed description in Methods). (b) A schematic representation of the analysed stages: MII: unfertilized eggs in metaphase of the second meiotic division. Stage 1: 2PB is formed and FC first appears. Stage 2: FC is fully formed. Stage 3: FC regresses and pronuclei are formed. (c) Mean cytoplasmic speed in a representative unfertilized egg. (d) Mean cytoplasmic speed in a representative in vivo fertilized zygote during Stages 1–3. (e) DIC images with vector patterns representative for unfertilized eggs (MII) and for zygotes in Stage 1–3. For clarity, only every second vector is shown. Length of the vectors and colour of the background indicate speed of the local cytoplasmic movement. Scale bar, 10 μm.
Figure 2
Figure 2. Cytoplasmic speed peaks depend on changes in the actomyosin cytoskeleton in the FC region.
(a) DIC images of the zygote with a pulsating FC: the FC (marked with an asterisk) protrudes and flattens in a repetitive way. Scale bar, 20 μm. (b) Peaks of the mean cytoplasmic speed in the fertilized mouse egg (blue) correlate with the beginning of a decrease in the FC diameter (green). The FC diameter was measured as shown in (a) from the point of maximum symmetry on the edge of the FC to the other edge of the cell. (c) Change in the FC diameter (measured as a difference between FC diameter immediately before the speed peak and at the timepoint when the speed peak reaches its maximum) correlates with the amplitude of the accompanying speed peak. The Pearson correlation coefficient calculated for these measurements is 0.595 and is statistically significant (P<0.0001). (d) Intensity of UtrCH–EGFP fluorescence in the cortex of the FC (blue) fluctuates as the FC changes its shape (as shown by changes in the FC diameter (red)). Intensity values are presented as a ratio between UtrCH–EGFP and Gap43–RFP (a membrane protein) fluorescence, to eliminate intensity changes caused by shifts in the focus (see Methods for the details). Asterisks show ends of the cortical region in which intensities of UtrCH–EGFP and Gap43–RFP were measured. Scale bar 10 μm. (e) Intensity of MyoRLC–GFP fluorescence in the lower and upper shoulder of the FC (blue line and blue line with crosses, respectively) fluctuates as the FC changes its shape (as shown by changes in the FC diameter (red)). Intensity values are presented as a ratio between UtrCH–EGFP and Gap43–RFP fluorescence. Asterisks mark the regions in which intensities of MyoRLC–GFP and Gap43–RFP were measured. Scale bar 10 μm. (f) Mean cytoplasmic speed in representative zygotes treated with nocodazole (blue line), cytochalasin D (red line) and ML-7 (green line). (g) Mean cytoplasmic speed in representative zygotes treated with taxol (blue line) and jasplakinolide (red line). The peak visible at approx. 90 min is due to a shift in focus.
Figure 3
Figure 3. Cytoplasmic speed peaks depend on free Ca2+ oscillations.
Peaks of mean cytoplasmic speed (blue) and free Ca2+ levels (green) in a representative fertilized egg (a), fertilized egg treated with BAPTA-AM (b) and egg activated with SrCl2 (c). When eggs were activated with SrCl2, Ca2+ transients were not accompanied by even small speed peaks (insert in (c)). In all graphs, the increase in Ca2+ level was reflected by a decrease in the intensity of FuraRed fluorescence. A peak in (b) was due to a shift in focus.
Figure 4
Figure 4. High amplitude cytoplasmic speed peaks depend on the presence of the FC.
Mean cytoplasmic speed (blue) and free Ca2+ levels (green) in representative eggs subjected to ICSI. A fresh sperm head was injected under the cortex (a) or in the central part of the cytoplasm (b). A heat-inactivated sperm head was injected under the cortex and then the egg was either activated (c) or not activated (d) with SrCl2. In eggs injected with heated sperm heads and activated with SrCl2, small speed peaks were frequently present (insert in (c)). In all graphs, the increase in Ca2+ level was reflected by a decrease in the intensity of FuraRed fluorescence.
Figure 5
Figure 5. Cytoplasmic movements as an indicator for viability of embryos.
Correlation between mean basal speeds (a) or mean inter-speed peak intervals (b) recorded in zygotes and the number of cells in the embryos after 4 days of culture. (c) Mathematical model fitted to the data in (a), showing linear and quadratic correlation between mean basal speeds and number of cells in the 4-day-old embryos with an adjustment for different values of the mean interpeak intervals. (d) Mathematical model fitted to the data in (b), showing linear correlation between mean interpeak intervals and number of cells in the 4-day-old embryos with an adjustment for different values of the mean basal speeds. Graphic representation of the models in (c) and (d) was prepared for values in range indicated with red brackets in (a) and (b), respectively. (e) An egg cylinder (left) and 2-week-old pups (right) obtained from embryos scored as of high quality based on our model. Actin-labelled with phalloidin in green and Gata4 marking visceral endoderm in red. Scale bar 50 μm. (f) Efficiency of embryo transfers. Embryos were scored as of 'high quality' or 'low quality', according to our model, transferred at 2-cell stage to the recipient females and dissected at 6.5 (blue columns) or 19.5 dpc (red columns).

References

    1. Roegiers F., McDougall A. & Sardet C. The sperm entry point defines the orientation of the calcium-induced contraction wave that directs the first phase of cytoplasmic reorganization in the ascidian egg. Development 121, 3457–3466 (1995). - PubMed
    1. Sardet C., Paix A., Prodon F., Dru P. & Chenevert J. From oocyte to 16-cell stage: cytoplasmic and cortical reorganizations that pattern the ascidian embryo. Dev. Dyn. 236, 1716–1731 (2007). - PubMed
    1. Speksnijder J. E., Sardet C. & Jaffe L. F. The activation wave of calcium in the ascidian egg and its role in ooplasmic segregation. J. Cell Biol. 110, 1589–1598 (1990). - PMC - PubMed
    1. Stack C., Lucero A. J. & Shuster C. B. Calcium-responsive contractility during fertilization in sea urchin eggs. Dev. Dyn. 235, 1042–1052 (2006). - PMC - PubMed
    1. Weaver C. & Kimelman D. Move it or lose it: axis specification in Xenopus. Development 131, 3491–3499 (2004). - PubMed

Publication types