. 2011 Aug 9:2:424.
doi: 10.1038/ncomms1433.

Cytosine methylation regulates oviposition in the pathogenic blood fluke Schistosoma mansoni

Affiliations

Cytosine methylation regulates oviposition in the pathogenic blood fluke Schistosoma mansoni

Kathrin K Geyer et al. Nat Commun. .

Abstract

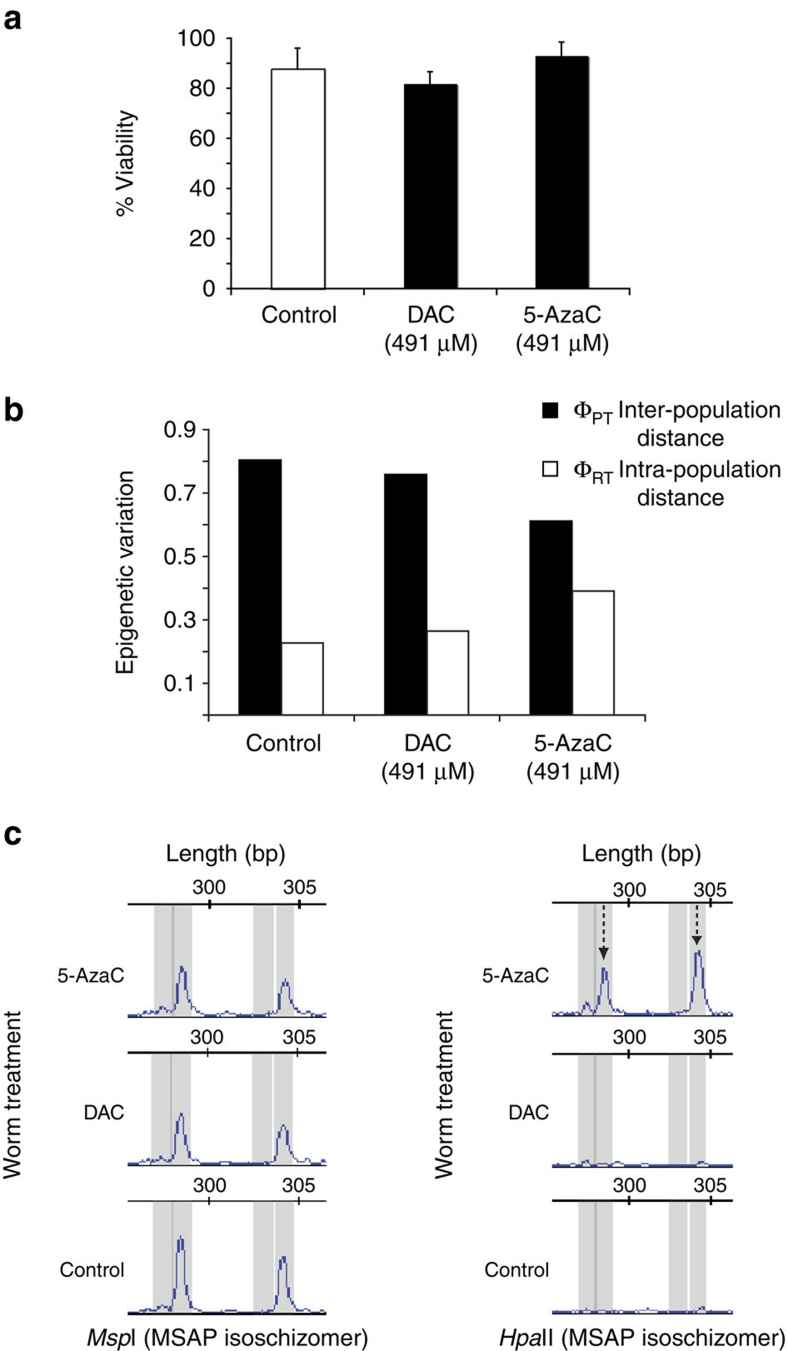
Similar to other metazoan pathogens, Schistosoma mansoni undergoes transcriptional and developmental regulation during its complex lifecycle and host interactions. DNA methylation as a mechanism to control these processes has, to date, been discounted in this parasite. Here we show the first evidence for cytosine methylation in the S. mansoni genome. Transcriptional coregulation of novel DNA methyltransferase (SmDnmt2) and methyl-CpG-binding domain proteins mirrors the detection of cytosine methylation abundance and implicates the presence of a functional DNA methylation machinery. Genome losses in cytosine methylation upon SmDnmt2 silencing and the identification of a hypermethylated, repetitive intron within a predicted forkhead gene confirm this assertion. Importantly, disruption of egg production and egg maturation by 5-azacytidine establishes an essential role for 5-methylcytosine in this parasite. These findings provide the first functional confirmation for this epigenetic modification in any worm species and link the cytosine methylation machinery to platyhelminth oviposition processes.


Figures

Figure 1
Figure 1. Schistosoma mansoni contains a methylated genome.
(a) GC–MS identification of m5C from mixed-sex, adult schistosome gDNA (compared with m5C standard). Selective ion-monitoring (m/z=296.2) by MS confirmed the presence of m5C in schistosome gDNA (right panel), which corresponded to an eluted GC peak at 15.7 min (left and middle panel). (b) ELISA detection of m5C across the schistosome lifecycle. Histograms (+, s.d.) represent mean m5C abundance (n=2 for each lifecycle stage), which was normalized (to both positive and negative control DNA samples). Data are representative of two independent experiments. Inset: agarose gel illustrates that schistosome gDNA isolated from life stages resident in the definitive host (E, egg; AM, adult male; AF, adult female) were not contaminated by M. musculus (Mm) gDNA. Primers designed to amplify M. musculus (Mm) catalase (653 bp product, solid arrow, NCBI accession number X52108.1) and S. mansoni (Sm) Venom Allergen Like (VAL) 2 (291 bp product, dashed arrow, NCBI accession number AY994062.1) were used. (−) represents PCR conditions when no gDNA was included and MW represents molecular weight standards. (c) m5C immunolocalization/GISH analysis of cytological spreads derived from S. mansoni (Sm) infected B. glabrata (Bg) snails. Anti-mouse m5C (IgG1) and isotype control (murine IgG1) primary antibodies were detected by Alexa Fluor 488 F(ab')2 goat anti-mouse IgG (H+L) secondary antibodies (green) during immunolocalization, whereas rhodamine (red)-labelled Sm gDNA was used to detect Sm nuclei during GISH. 4,6-Diamidio-2-phenylindole (blue) was used as a counter stain to identify both Bg and Sm nuclei. Scale bar, 2 μm. (d) MSAP analysis of m5C in gDNA obtained from cercariae and adult worms. HpaII (filled shapes) and MspI (open shapes) isoschizomers were used to restrict mixed-sex adult worm (triangles) and cercariae (circles) gDNA samples. Seven replicate samples were analysed for both schistosome life stages. MSAP data is illustrated by principal coordinate analysis. HpaII loci enclosed by a dashed circle represent m5C identified in cercariae and HpaII loci enclosed by a solid circle represent m5C identified in adults.
Figure 2
Figure 2. S.mansoni forkhead protein contains a highly methylated intragenic intron.
(a) Smp_155010 (ten exons—solid blocks, sequentially numbered and nine introns—black lines) is a predicted 37,170 bp gene encoding a forkhead protein found in scaff000180 of genome assembly 4.0. A m5C enrichment protocol initiated with cercarial gDNA yielded a highly methylated 316 bp locus, NCBI accession number JF781495 (red box; mapping to a repetitive element-rich region spanning 24,803–25,119 bp of intron 8), found within Smp_155010. (b) %GC representation of S.mansoni genomic elements containing the methylated locus. (c) Enumeration of m5C abundance (dinucleotide context percentages) in clones (n=33) derived from bisulfite-PCR amplification of JF781495 after bisulfite cercarial gDNA conversion. The 42 cytosine positions within the 199-bp PCR product are indicated on the abscissa (5′–3′). Solid line represents mean false m5C discovery rate (FDR) derived from control bisulfite reactions (Methods) and dotted line represents mean FDR+3×s.e.m.
Figure 3
Figure 3. SmDnmt2 is a functional DNA methyltransferase.
Adult schistosome pairs (five pairs per treatment) were electroporated with siRNAs directed against SmDnmt2 or luciferase (negative control) according to the Methods section. (a) Quantitative real-time reverse transcription PCR (qRT–PCR) was used to assess the efficiency of SmDnmt2 silencing at 48 h post electroporation. All reactions were performed in triplicate (from biologically replicated samples, n=2) and SmDnmt2 expression was normalized to α-tubulin, SmAT1. Error bars represent the standard error of the normalized means (s.e.m.). Results are representative of three independent experiments. (b) AMOVA analysis of MSAP profiles was used to assess the degree of CpG cytosine methylation loss after 96 h post electroporation (five biologically replicated male samples/siRNA treatment). Epigenetic variation between HpaII peaks derived from siSmDnmt2-treated worms compared with HpaII peaks derived from siLuciferase-treated worms is statistically significant (AMOVA analysis, **P=0.008). (c) GeneMapper representation of an adult schistosome locus (arrow) where cytosine methylation is lost (loss of HpaII sensitivity) upon SmDnmt2 silencing. MspI/HpaII represent the isoschizomers used to restrict gDNA before MSAP analysis. (d) Enumeration of m5C abundance (percentages) in 33 clones (siSmDnmt2, n=16; siLuciferase, n=17) derived from bisulfite-PCR amplification of JF781495 after bisulfite conversion of adult worm gDNA. The 42 cytosine positions within the 199 bp PCR product are indicated on the abscissa (5′–3′). Solid line represents mean false m5C discovery rate (FDR) derived from control bisulfite reactions and dotted line represents FDR mean+3×s.e.m. *Indicates the cytosine positions affected by SmDnmt2 silencing.
Figure 4
Figure 4. SmDnmt2 and SmMBD are transcriptionally coregulated during schistosome development.
(a) qRT–PCR determination of SmDnmt2- (black histograms) and SmMBD- (grey histograms) expression across the schistosome lifecycle. All reactions were performed in triplicate and SmDnmt2 and SmMDB expression were independently normalized to α-tubulin, SmAT1 (left ordinate=SmMBD/SmAT1; right ordinate=SmDnmt2/SmAT1). Error bars represent standard error of the normalized means (s.e.m.). A one-way analysis of variance (ANOVA) followed by post hoc testing with Fisher's Least Significant Difference (LSD) was used to detect statistical differences (**P<0.001) in normalized gene expression between lifecycle stages. Intra-molluscan—schistosome life stages developing within the intermediate host; Intra-mammalian—parasite life stages developing within the definitive host. (b) DNA methyltransferase activity measured in adult female and male schistosome nuclei (relative fluorescence units (RFU) at excitation=530 nm and emission=590 nm). Dashed line represents background DNA methyltransferase activity (negative control). Left ordinate scale represents DNA methyltransferase activity obtained from the positive Dnmt1 control (n=2 biological replicates) and right ordinate scale represents DNA methyltransferase activity of parasite or negative control samples (n=2 biological replicates). Error bars represent the s.d. A one-way ANOVA followed by post hoc testing with Fisher's LSD was used to detect statistical differences (*P<0.05) between gender.
Figure 5
Figure 5. Schistosome cytosine methylation is affected by 5-azacytidine (5-AzaC) but not decitabine (DAC).
(a) The helminth fluorescent bioassay indicated that neither 5-AzaC nor DAC was toxic to adult male schistosomes (open histogram—% mean viability of control adult worms; filled histogram—% mean viability of adult worms treated with either 491 μM 5-AzaC or 491μM DAC). Error bars represent standard error of the normalized % viability mean (s.e.m.) collected from three individual worms. (b) AMOVA analysis of MSAP profiles was used to assess the degree of cytosine methylation loss after 48 h treatment with 5-AzaC (n=4 adult male biological replicates) and DAC (n=4 adult male biological replicates) compared with controls (n=4 adult male biological replicates). (c) GeneMapper representation of two adult male schistosome loci (dashed arrows) where CpG cytosine methylation is lost (loss in HpaII sensitivity) upon 5-AzaC, but not DAC, treatment. MspI/HpaII represent the isoschizomers used to restrict gDNA before MSAP analysis.
Figure 6
Figure 6. 5-Azacytidine inhibits S. mansoni DNA methylation in a dose-dependent manner.
(a) Adult schistosome gDNA isolated from adult male worm cultures (control, 10 μM 5-AzaC and 491 μM 5-AzaC) were examined for the presence of M. musculus gDNA contamination by PCR before MSAP analyses. Primers designed to amplify M. musculus (Mm) catalase and S. mansoni (Sm) Venom Allergen Like (VAL) 2 were used. Mm catalase primers only amplified a product (sequence verified catalase, 653 bp, solid arrow) when Mm gDNA was used as a template. SmVAL2 primers only amplified a product (sequence verified SmVAL2, 291 bp, dashed arrow) when Sm gDNA was used as a template. (−) represents PCR conditions when no gDNA was included in the reaction and MW represents molecular weight standards. (b) MSAP analysis of m5C in gDNA obtained from 5-AzaC-treated adult male worms. HpaII (open shapes) and MspI (filled shapes enclosed by dashed circle) isoschizomers were used to restrict adult worm gDNA from control samples (squares), 10-μM 5-AzaC-treated samples (triangles) and 491-μM 5-AzaC-treated samples (circles). Five biological replicates were analysed for all treatments/enzyme combinations. The dose-dependent demethylating ability of 5-AzaC is illustrated by principal coordinate analysis. (c) Statistical assessment of MSAP profiles by AMOVA. Significant differences (P<0.01) in epigenetic variation are found between populations (ΦPT; HpaII-MspI inter-population distances between controls, 10 μM- and 491 μM-5-AzaC samples) and within populations (ΦRT; HpaII intra-population distances among controls compared with HpaII intra-population distances among 5-AzaC-treated worms).
Figure 7
Figure 7. Schistosome egg development and ovarian architecture are regulated by cytosine methylation.
(a) 5-Azacytidine (5-AzaC) inhibits egg production in a dose-dependent manner. Histograms represent mean (+s.e.m.) egg output derived from five worm pairs (n=4) cultured for 48 h. A one-way analysis of variance (ANOVA) followed by post hoc testing with Fisher's Least Significant Difference (LSD) was used to detect statistical differences (*P<0.05) in egg production among groups (control, 10 μM 5-AzaC and 100 μM 5-AzaC). Data are derived from a representative experiment (replicated five times). (b) Confocal microscopy of schistosome eggs laid by control worm pairs (control) or 5-AzaC-treated worm pairs (5-AzaC, 100 μM). Scale bar, 20 μm. (c) Confocal microscopy of normal adult females (control) or 5-AzaC-treated females (5-AzaC, 100 μM) stained with Langeron's Carmine and imaging focused on a region containing the intra-uterine egg. Scale bar, 20 μm. (d) 5-AzaC inhibits egg development as assessed by in vitro staging. Eggs deposited by control females (control) or 5-AzaC-treated females (5-AzaC, 100 μM) were left to develop as described in the Methods section and maturation classified according to four categories (stage I+II, stage III−V, hatched or unidentified; scale bar, 20 μm). The percentage of eggs displaying each developmental stage is indicated by a stacked histogram and is representative of two independent experiments. (e) Confocal microscopy of normal adult females (control) or 5-AzaC-treated females (5-AzaC, 100 μM) stained with Langeron's Carmine and imaging focused on a region containing the ovary. Scale bar, 20 μm. Io, immature oocyte; mo, mature oocyte; v, vacuole.

References

    1. King C. H. & Dangerfield-Cha M. The unacknowledged impact of chronic schistosomiasis. Chronic Illn. 4, 65–79 (2008). - PubMed
    1. Hotez P. J. & Fenwick A. Schistosomiasis in Africa: an emerging tragedy in our new global health decade. PLoS Negl. Trop. Dis. 3, e485 (2009). - PMC - PubMed
    1. van der Werf M. J. et al.. Quantification of clinical morbidity associated with schistosome infection in sub-Saharan Africa. Acta Trop 86, 125–139 (2003). - PubMed
    1. Cioli D. & Pica-Mattoccia L. Praziquantel. Parasitol. Res. 90 (suppl. 1), S3–S9 (2003). - PubMed
    1. Hockley D. J. & McLaren D. J. Schistosoma mansoni: changes in the outer membrane of the tegument during development from cercaria to adult worm. Int. J. Parasitol. 3, 13–25 (1973). - PubMed

Publication types