Review
. 2011 Aug 10;12(9):509-23.
doi: 10.1038/nrn3084.

Cortical state and attention

Affiliations
Review

Cortical state and attention

Kenneth D Harris et al. Nat Rev Neurosci. .

Abstract

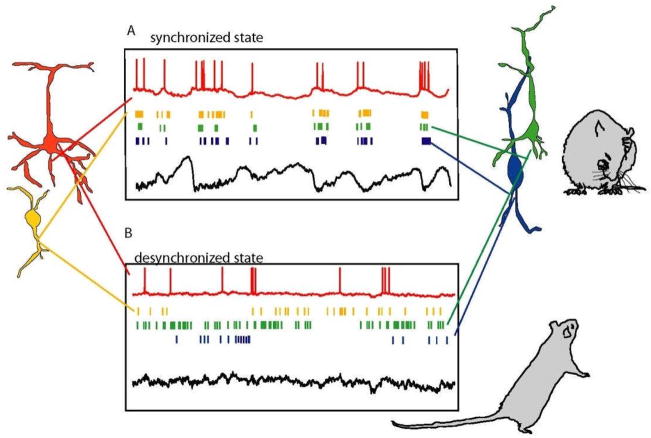
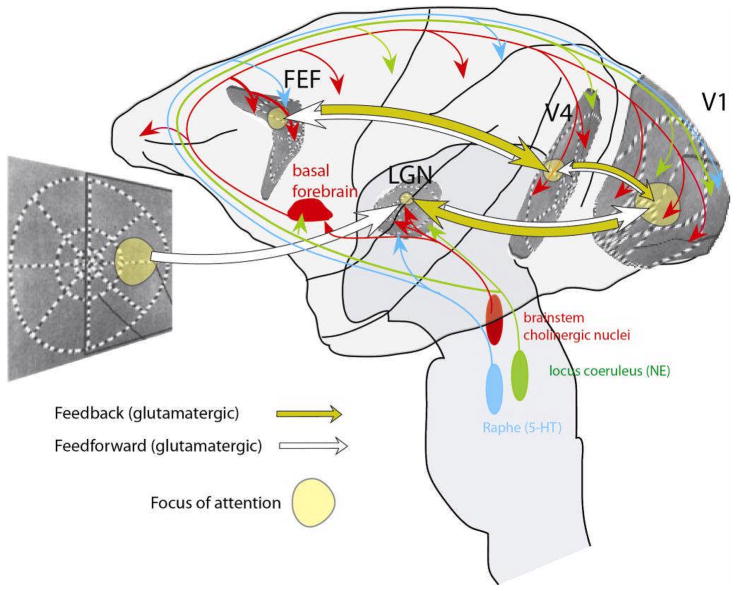
The brain continuously adapts its processing machinery to behavioural demands. To achieve this, it rapidly modulates the operating mode of cortical circuits, controlling the way that information is transformed and routed. This article will focus on two experimental approaches by which the control of cortical information processing has been investigated: the study of state-dependent cortical processing in rodents and attention in the primate visual system. Both processes involve a modulation of low-frequency activity fluctuations and spiking correlation, and are mediated by common receptor systems. We suggest that selective attention involves processes that are similar to state change, and that operate at a local columnar level to enhance the representation of otherwise non-salient features while suppressing internally generated activity patterns.


Figures

Figure 1
Figure 1
Cartoon Illustration of how population activity patterns vary with cortical state. The two panels illustrate two extremes of a continuum of states seen in awake rodents. A. In synchronized states, cortical populations show spontaneous common fluctuations in firing rate. During the active phase, all neuronal classes show a propensity to fire (coloured rasters), whereas during the silent phase, spiking is reduced or absent. These phases are accompanied by corresponding depolarization and hyperpolarization in intracellular potentials (red, top). Deep-layer cortical local field potential (black, bottom) shows slow negative waves accompanied by high-frequency activity in the active phase, and smooth dome-shaped positive waves in the silent phase. This type of activity is seen in drowsy or quiescent animals (right). B. In the desynchronized state, coordinated slow fluctuations in population activity are not seen, and low-frequency fluctuations in the local field potential and membrane potentials are suppressed. This type of activity is seen in actively behaving, alert animals (right).
Figure 2
Figure 2
Cortical LFP and behaviour. A, In this classical pen-chart recording, the correlation between behaviour and cortical EEG is difficult to detect visually under control conditions (top two traces, showing EEG and movement activity), but is greatly amplified by application of the muscarinic antagonist atropine (bottom two traces). B, A recent study showing a reduction of spontaneous fluctuations during whisking behaviour, clearly visible in intracranial LFP and membrane potential, but more difficult to detect visually in the surface EEG. C, In monkey V1, low-frequency (2–10Hz) power is reduced when attention is directed into the receptive field corresponding to the electrode site (att RF: red, green), and is increased by application of the muscarinic antagonist scopolamine (Scop: green, black) or when attention is directed to a different location (att away: blue, black). Part A is modified from Ref. , Part B from Ref. , Part C from recordings in the Thiele lab (Herrero, Delicato, Thiele: methods details in Ref. ).
Figure 3
Figure 3
Possible mechanisms of asynchronous and synchronous activity. A1, Correlations generated by shared excitatory input may be cancelled by rapid recurrent inhibition. A2, Raster showing spontaneous activity of simultaneously recorded population from rat somatosensory cortex in a desynchronized state. Bottom trace shows population rate as a function of time, showing a small degree of fluctuation. A3, Histogram of pairwise correlations in this population, with a mean close to zero but long tails indicating an approximately equal number of significant positively and negatively correlated pairs (insets). The gray curve indicates the distribution of correlations that would be expected by chance. B1, Excitable system model of slow fluctuations in cortical activity where up phases are generated and sustained by recurrent synaptic activity before being overcome by adaptive processes. B2, Raster showing spontaneous activity of same population as A2, but now in a synchronized state. B3, Histogram of pairwise correlations in this population, showing positive mean for the whole data set (red) but a mean close to zero when considering active phases only (yellow). Modified from Ref. .
Figure 4
Figure 4
Desynchronization suppresses responses to punctuate stimuli, but decreases adaptation and enhances representation of temporally extended stimuli. A, State-dependent responses to stimulus trains in barrel cortex of anesthetized (left) or awake rats (right). In synchronized states under anaesthesia and in quiescent awake animals (open circles), responses to rare punctuate stimuli are large, but responses adapt strongly at high repetition frequencies. After electrical stimulation of reticular formation (RF) or during active behaviour (solid circles), responses to rare stimuli are smaller but adaptation is reduced. B, Raster representation of a visual cortical unit response to repeated presentations of a temporally extended natural scene movie. Stimulation of nucleus basalis (NB) increases reliability of responses from trial-to-trial. C, Response in auditory cortex to repeated presentations of a temporally extended amplitude-modulated noise stimulus. Evoked LFPs (coloured curves) from two presentations of the same stimulus in synchronized (blue and cyan) and desynchronized (red and magenta) states, as well as raster representation of spikes from one cell in response to repeated presentations in each state. Black curve (bottom) shows stimulus envelope. LFP and spiking responses are more reliable in desynchronized state. Part A is modified from Ref. , Part B from Ref. , Part C from Ref. .
Figure 5
Figure 5
Suggested mechanisms underlying widespread and focused desynchronization during state changes and attention. Increased activity of cortical neuromodulatory afferents (red [cholinergic], blue [serotonergic] and green [noradrenergic] arrows) causes a general desynchronization and reduction in spontaneous fluctuation, but may lack the spatial selectivity to desynchronize the patch of cortex representing the attended stimulus. Focused glutamatergic inputs arising from feedback connections could provide this specificity (yellow arrows), causing enhanced desynchronization and sensory responses in the regions of cortex that represent the attended stimulus. The yellow circle in the visual display indicates the focus of attention, which affects processing in thalamic and cortical areas at specific locations (indicated by the yellow patches). The distorted replication of the visual world in the different areas illustrates (approximately) the known retinotopic organization of these different areas.

References

    1. Ringach DL. Spontaneous and driven cortical activity: implications for computation. Curr Opin Neurobiol. 2009;19:439–44. - PMC - PubMed
    1. Steriade M, McCarley RW. Brainstem control of wakefulness and sleep. Plenum Press; New York: 2005.
    1. Greenberg DS, Houweling AR, Kerr JN. Population imaging of ongoing neuronal activity in the visual cortex of awake rats. Nat Neurosci. 2008;11:749–51. - PubMed
    1. DeWeese MR, Zador AM. Non-Gaussian membrane potential dynamics imply sparse, synchronous activity in auditory cortex. J Neurosci. 2006;26:12206–12218. - PMC - PubMed
    1. Crochet S, Petersen CC. Correlating whisker behavior with membrane potential in barrel cortex of awake mice. Nat Neurosci. 2006;9:608–10. - PubMed

Publication types