. 2011 Jul;7(7):e1002143.
doi: 10.1371/journal.ppat.1002143. Epub 2011 Jul 28.

The cost of virulence: retarded growth of Salmonella Typhimurium cells expressing type III secretion system 1

Affiliations

The cost of virulence: retarded growth of Salmonella Typhimurium cells expressing type III secretion system 1

Alexander Sturm et al. PLoS Pathog. 2011 Jul.

Abstract

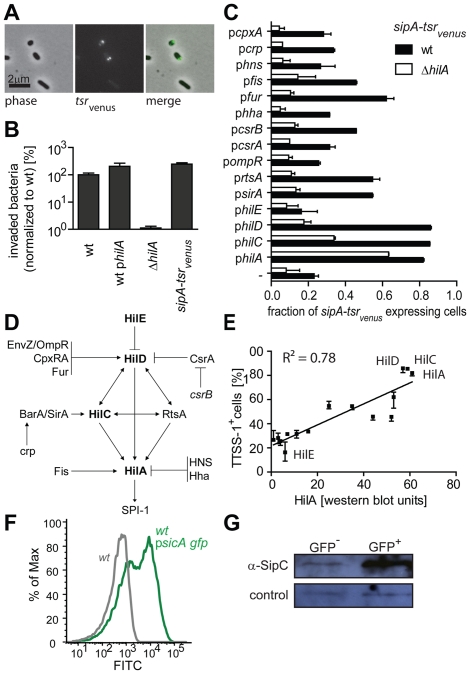
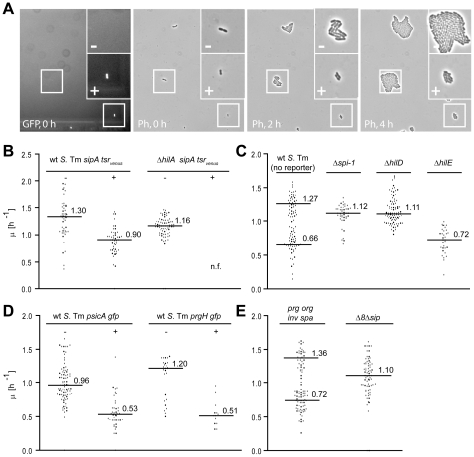
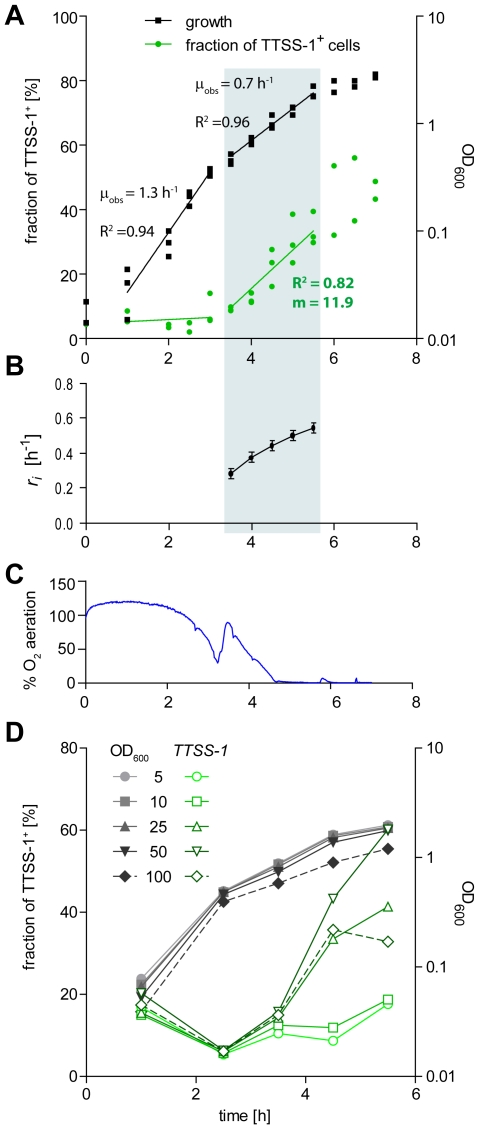
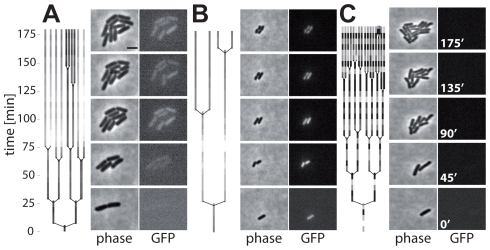
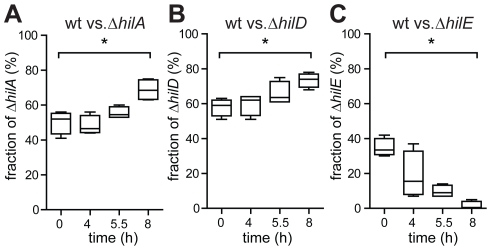
Virulence factors generally enhance a pathogen's fitness and thereby foster transmission. However, most studies of pathogen fitness have been performed by averaging the phenotypes over large populations. Here, we have analyzed the fitness costs of virulence factor expression by Salmonella enterica subspecies I serovar Typhimurium in simple culture experiments. The type III secretion system ttss-1, a cardinal virulence factor for eliciting Salmonella diarrhea, is expressed by just a fraction of the S. Typhimurium population, yielding a mixture of cells that either express ttss-1 (TTSS-1(+) phenotype) or not (TTSS-1(-) phenotype). Here, we studied in vitro the TTSS-1(+) phenotype at the single cell level using fluorescent protein reporters. The regulator hilA controlled the fraction of TTSS-1+ individuals and their ttss-1 expression level. Strikingly, cells of the TTSS-1(+) phenotype grew slower than cells of the TTSS-1(-) phenotype. The growth retardation was at least partially attributable to the expression of TTSS-1 effector and/or translocon proteins. In spite of this growth penalty, the TTSS-1(+) subpopulation increased from <10% to approx. 60% during the late logarithmic growth phase of an LB batch culture. This was attributable to an increasing initiation rate of ttss-1 expression, in response to environmental cues accumulating during this growth phase, as shown by experimental data and mathematical modeling. Finally, hilA and hilD mutants, which form only fast-growing TTSS-1(-) cells, outcompeted wild type S. Typhimurium in mixed cultures. Our data demonstrated that virulence factor expression imposes a growth penalty in a non-host environment. This raises important questions about compensating mechanisms during host infection which ensure successful propagation of the genotype.


Conflict of interest statement

The authors have declared that no competing interests exist.

Figures

Figure 1
Figure 1. sipA-tsrvenus as a single cell reporter for ttss-1 expression.
A) Bistable expression of sipA-tsrvenus in wt S. Tm (M2001). Living bacteria (4 h in LB) were imaged by fluorescence- and phase contrast microscopy. Bar, 2 µm; B) Invasion into MDCK cells (3 indep. experiments; ±s.d.; Materials and Methods). C) Response of the sipA-tsrvenus reporter to over-expression of known ttss-1 regulators. Wt S. Tm (sipA-tsrvenus; M2001; black bars) or ΔhilA (sipA-tsrvenus; M2018; open bars) harboring the indicated regulator-expression plasmids (Table S2) were cultured for 4 h in LB and FACS-analyzed (triplicates ±s.d.). D) ttss-1 regulation cascade depicting the regulators analyzed in C) and E; adapted from [35], [36], [59], [60], [61], [62]). E) Correlation between HilA protein levels and the fraction of ttss-1 expressing individuals. The fraction of cells with the TTSS-1+ phenotype (from C) was plotted against the average HilA expression (average of ≥3 independent quantitative Western blots per regulator and strain). F) Bistable expression of psicA-gfp in S. Tm SL1344 determined and separated by FACS; G) Western blot analysis of TTSS-1- and TTSS-1+ subpopulations from F) using a polyclonal rabbit α-SipC antibody.
Figure 2
Figure 2. Time-lapse microscopy reveals retarded growth of TTSS-1+ individuals.
Bacteria (4 h LB subculture, OD600 = 1), were placed on an agar pad (37°C) and imaged to detect ttss-1 expression (fluorescence) and growth (phase contrast; 1 frame/30 min). A) Sample images from a typical time-lapse microscopy experiment with wt S. Tm (SL1344, psicA-gfp). B)-D): Time-lapse microscopy experiments with wt S. Tm (M2001; sipA-tsrvenus) and an isogenic hilA mutant (M2018; sipA-tsrvenus; B); wt S. Tm (SL1344; no reporter) and mutants lacking ttss-1, hilD or hilE (no reporter); C); wt S. Tm (SL1344; psicA-gfp and an isogenic wt reporter strain (SL1344 prgH-gfp; D); mutants lacking most genes encoding the TTS apparatus (prg-org, inv-spa) or most effector proteins and the translocon (Δ8Δsip); E). Each data point represents the growth rate of an individual micro colony. Data were from ≥3 independent experiments. Black line, median; Numbers, median growth rates.
Figure 3
Figure 3. Time course experiment analyzing the initiation of ttss-1 expression.
A) Wt S. Tm (SL1344, psicA-gfp) was sub-cultured under mild aeration in LB. Growth (OD600, black) and ttss-1 expression (FACS, green) was analyzed and fitted separately for early and late log phase. Gray: late logarithmic phase. m: apparent initiation rate of ttss-1 expression, as determined from the slope of the fitted line. B) Calculation of the mean value of ri(t) during the late log phase using eq. 4, data from A) and 86 individual µT1 values for S. Tm psicA gfp (from Fig. 2D); error bars depict the SEM. C) pO2 during the experiment. D) Growth (OD600, black) and ttss-1 expression (FACS, green) in 250 ml flasks (shaken 160 rpm, 37°C) harboring the indicated volume of LB (inoculation: 1/100 from a 12 h S. Tm psicA-gfp culture).
Figure 4
Figure 4. Time-lapse microscopy shows onset of ttss-1 expression and concomitant growth retardation.
Lineage trees with corresponding phase contrast and GFP images of S. Tm (M556; psicA-gfp) grown on agar pads with spent LB. Coloring of the lineage trees reflects the relative mean GFP intensity of individual cells (dark = low; light = high; scaled to the highest fluorescence in tree). A) On-switching of ttss-1 expression in a fraction of the micro colony. B) Micro colony uniformly expressing ttss-1 throughout the assay. C) Micro colony not expressing ttss-1 throughout the assay. Scale bar, 2 µm; see also Fig. S4.
Figure 5
Figure 5. Competitive growth experiment confirming that ttss-1 expression retards growth.
A) Wt S. Tm (ATCC14028, kmS) and an isogenic hilA mutant (M2005, kmR), were used to inoculate a sub-culture at a ratio of approx. 1∶1. Growth of the mixed culture was monitored via OD600. B) Competitive growth between wt S. Tm and an isogenic hilD mutant (M2007, kmR), resp. an isogenic hilE mutant (M2008, cmR), C). The fraction of wt S. Tm was determined by differential plating on LB agar (50 µg/ml kanamycin, resp. 30 µg/ml chloramphenicol) at the indicated time points. Data were derived from four experiments (±s.d., p = 0.014).

References

    1. Hautefort I, Proenca MJ, Hinton JC. Single-copy green fluorescent protein gene fusions allow accurate measurement of Salmonella gene expression in vitro and during infection of mammalian cells. Appl Environ Microbiol. 2003;69:7480–7491. - PMC - PubMed
    1. Schlumberger MC, Muller AJ, Ehrbar K, Winnen B, Duss I, et al. Real-time imaging of type III secretion: Salmonella SipA injection into host cells. Proc Natl Acad Sci U S A. 2005;102:12548–12553. - PMC - PubMed
    1. Winnen B, Schlumberger MC, Sturm A, Schupbach K, Siebenmann S, et al. Hierarchical effector protein transport by the Salmonella Typhimurium SPI-1 type III secretion system. PLoS ONE. 2008;3:e2178. - PMC - PubMed
    1. Ackermann M, Stecher B, Freed NE, Songhet P, Hardt WD, et al. Self-destructive cooperation mediated by phenotypic noise. Nature. 2008;454:987–990. - PubMed
    1. Saini S, Ellermeier JR, Slauch JM, Rao CV. The role of coupled positive feedback in the expression of the SPI1 type three secretion system in Salmonella. PLoS Pathog. 2010;6:e1001025. - PMC - PubMed

Publication types

MeSH terms