

Genetic loci associated with plasma phospholipid n-3 fatty acids: a meta-analysis of genome-wide association studies from the CHARGE Consortium
- PMID: 21829377
- PMCID: PMC3145614
- DOI: 10.1371/journal.pgen.1002193
Genetic loci associated with plasma phospholipid n-3 fatty acids: a meta-analysis of genome-wide association studies from the CHARGE Consortium
Abstract
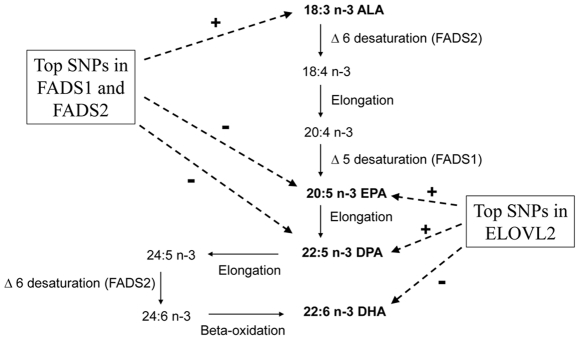
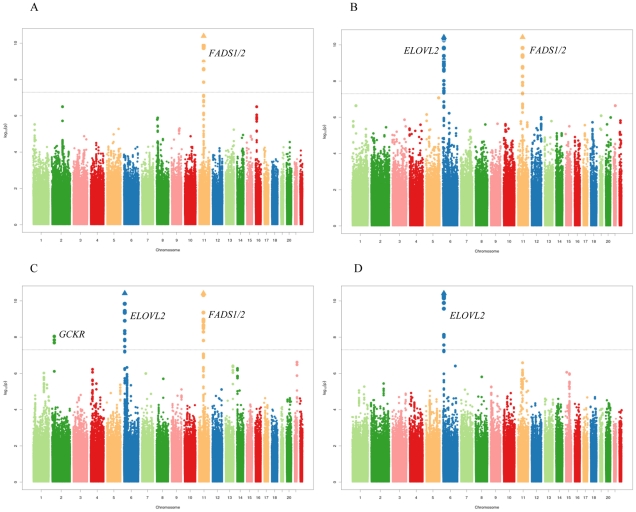
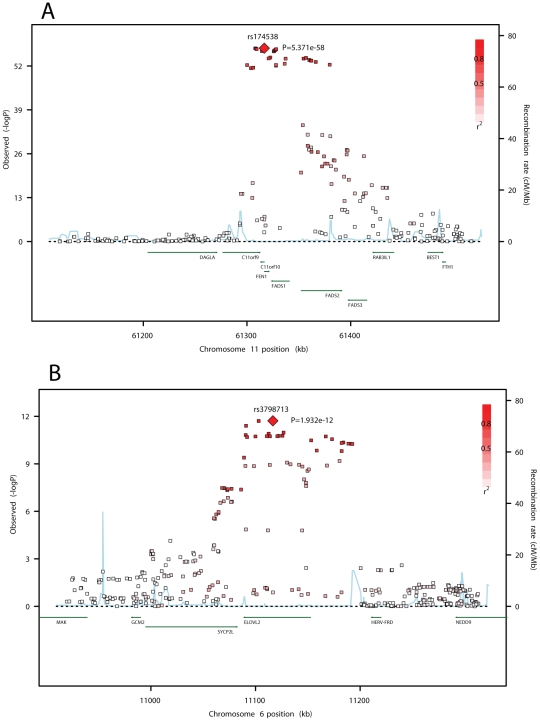
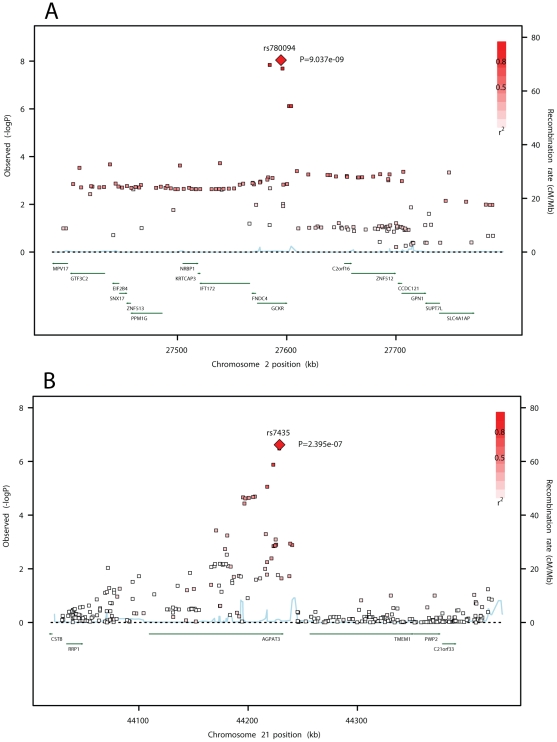
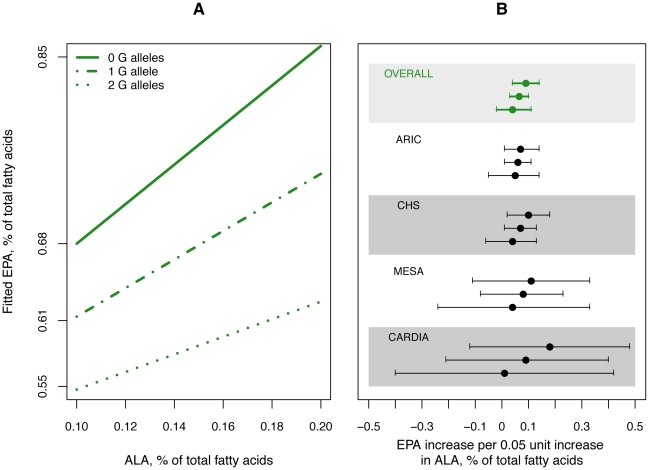
Long-chain n-3 polyunsaturated fatty acids (PUFAs) can derive from diet or from α-linolenic acid (ALA) by elongation and desaturation. We investigated the association of common genetic variation with plasma phospholipid levels of the four major n-3 PUFAs by performing genome-wide association studies in five population-based cohorts comprising 8,866 subjects of European ancestry. Minor alleles of SNPs in FADS1 and FADS2 (desaturases) were associated with higher levels of ALA (p = 3 x 10⁻⁶⁴) and lower levels of eicosapentaenoic acid (EPA, p = 5 x 10⁻⁵⁸) and docosapentaenoic acid (DPA, p = 4 x 10⁻¹⁵⁴). Minor alleles of SNPs in ELOVL2 (elongase) were associated with higher EPA (p = 2 x 10⁻¹²) and DPA (p = 1 x 10⁻⁴³) and lower docosahexaenoic acid (DHA, p = 1 x 10⁻¹⁵). In addition to genes in the n-3 pathway, we identified a novel association of DPA with several SNPs in GCKR (glucokinase regulator, p = 1 x 10⁻⁸). We observed a weaker association between ALA and EPA among carriers of the minor allele of a representative SNP in FADS2 (rs1535), suggesting a lower rate of ALA-to-EPA conversion in these subjects. In samples of African, Chinese, and Hispanic ancestry, associations of n-3 PUFAs were similar with a representative SNP in FADS1 but less consistent with a representative SNP in ELOVL2. Our findings show that common variation in n-3 metabolic pathway genes and in GCKR influences plasma phospholipid levels of n-3 PUFAs in populations of European ancestry and, for FADS1, in other ancestries.
Conflict of interest statement
The authors have declared that no competing interests exist.
Figures
References
-
- Siscovick DS, Raghunathan TE, King I, Weinmann S, Wicklund KG, et al. Dietary intake and cell membrane levels of long-chain n-3 polyunsaturated fatty acids and the risk of primary cardiac arrest. Jama. 1995;274:1363–1367. - PubMed
-
- Lemaitre RN, King IB, Mozaffarian D, Sotoodehnia N, Rea TD, et al. Plasma phospholipid trans fatty acids, fatal ischemic heart disease, and sudden cardiac death in older adults: the cardiovascular health study. Circulation. 2006;114:209–215. - PubMed
-
- Sala-Vila A, Cofan M, Perez-Heras A, Nunez I, Gilabert R, et al. Fatty acids in serum phospholipids and carotid intima-media thickness in Spanish subjects with primary dyslipidemia. Am J Clin Nutr. 2010;92:186–193. - PubMed
Publication types
MeSH terms
Substances
Grants and funding
- R01 HL059367/HL/NHLBI NIH HHS/United States
- U01 HG004729/HG/NHGRI NIH HHS/United States
- N01-HC-48049/HC/NHLBI NIH HHS/United States
- M01 RR000425/RR/NCRR NIH HHS/United States
- R01HL071250/HL/NHLBI NIH HHS/United States
- R01HL086694/HL/NHLBI NIH HHS/United States
- HHSN268201100012C/HL/NHLBI NIH HHS/United States
- UL1RR025005/RR/NCRR NIH HHS/United States
- N01 HC045204/HL/NHLBI NIH HHS/United States
- N01 HC095095/HL/NHLBI NIH HHS/United States
- HHSN268201100009I/HL/NHLBI NIH HHS/United States
- N01-HC-45205/HC/NHLBI NIH HHS/United States
- R01 HL075366/HL/NHLBI NIH HHS/United States
- U01-HG-004446/HG/NHGRI NIH HHS/United States
- N01-HC-05187/HC/NHLBI NIH HHS/United States
- R01 HL071251/HL/NHLBI NIH HHS/United States
- U01 HG004446/HG/NHGRI NIH HHS/United States
- N01 HC048048/HL/NHLBI NIH HHS/United States
- HSN268200625226C/PHS HHS/United States
- R01HL59367/HL/NHLBI NIH HHS/United States
- HHSN268201100010C/HL/NHLBI NIH HHS/United States
- R01 HL071259/HL/NHLBI NIH HHS/United States
- UL1 RR025005/RR/NCRR NIH HHS/United States
- R01 AG015928/AG/NIA NIH HHS/United States
- R01 HL085710/HL/NHLBI NIH HHS/United States
- HHSN268201100008C/HL/NHLBI NIH HHS/United States
- U01 HL080295/HL/NHLBI NIH HHS/United States
- N01-HC-48047/HC/NHLBI NIH HHS/United States
- N02 HL064278/HL/NHLBI NIH HHS/United States
- N01 HC095169/HL/NHLBI NIH HHS/United States
- HHSN268201100005G/HL/NHLBI NIH HHS/United States
- R01 HL071252/HL/NHLBI NIH HHS/United States
- HHSN268201100008I/HL/NHLBI NIH HHS/United States
- HL085251/HL/NHLBI NIH HHS/United States
- HHSN268201100007C/HL/NHLBI NIH HHS/United States
- HL105756/HL/NHLBI NIH HHS/United States
- R01 MD009164/MD/NIMHD NIH HHS/United States
- RR-024156/RR/NCRR NIH HHS/United States
- N01 HC015103/HC/NHLBI NIH HHS/United States
- N01 HC085086/HL/NHLBI NIH HHS/United States
- R01 HL085251/HL/NHLBI NIH HHS/United States
- 263 MD 821336/MD/NIMHD NIH HHS/United States
- R56 AG020098/AG/NIA NIH HHS/United States
- HHSN268201100011I/HL/NHLBI NIH HHS/United States
- HHSN268201100011C/HL/NHLBI NIH HHS/United States
- R01 HL086694/HL/NHLBI NIH HHS/United States
- N01 HC048049/HL/NHLBI NIH HHS/United States
- UL1 RR024156/RR/NCRR NIH HHS/United States
- N01-HC-45204/HC/NHLBI NIH HHS/United States
- R01 HL071250/HL/NHLBI NIH HHS/United States
- N01-HC-95159/HC/NHLBI NIH HHS/United States
- R01 HL087652/HL/NHLBI NIH HHS/United States
- AG-20098/AG/NIA NIH HHS/United States
- N01-HC-95095/HC/NHLBI NIH HHS/United States
- U01 HG004402/HG/NHGRI NIH HHS/United States
- U01 HG004424/HG/NHGRI NIH HHS/United States
- HL087652/HL/NHLBI NIH HHS/United States
- R01-HL-084099/HL/NHLBI NIH HHS/United States
- R01HL071252/HL/NHLBI NIH HHS/United States
- N01-HC-85086/HC/NHLBI NIH HHS/United States
- N01 HC095159/HL/NHLBI NIH HHS/United States
- U01HG004402/HG/NHGRI NIH HHS/United States
- AG-027058/AG/NIA NIH HHS/United States
- N01-HC-48050/HC/NHLBI NIH HHS/United States
- R01 HL105756/HL/NHLBI NIH HHS/United States
- N01 HC045205/HL/NHLBI NIH HHS/United States
- R01HL071205/HL/NHLBI NIH HHS/United States
- AG-023269/AG/NIA NIH HHS/United States
- HL075366/HL/NHLBI NIH HHS/United States
- HHSN268201100006C/HL/NHLBI NIH HHS/United States
- N01 HC-55222/HC/NHLBI NIH HHS/United States
- P30 DK063491/DK/NIDDK NIH HHS/United States
- R01 HL071051/HL/NHLBI NIH HHS/United States
- M01RR00425/RR/NCRR NIH HHS/United States
- R01HL087641/HL/NHLBI NIH HHS/United States
- U01-HG-004424/HG/NHGRI NIH HHS/United States
- N01 HC055222/HL/NHLBI NIH HHS/United States
- N01-HC-95169/HC/NHLBI NIH HHS/United States
- HHSN268201100005I/HL/NHLBI NIH HHS/United States
- N01-HC-75150/HC/NHLBI NIH HHS/United States
- R01 HL084099/HL/NHLBI NIH HHS/United States
- N01 HC045134/HC/NHLBI NIH HHS/United States
- N01 HC005187/HL/NHLBI NIH HHS/United States
- N01 HC085079/HL/NHLBI NIH HHS/United States
- R01 HL080295/HL/NHLBI NIH HHS/United States
- N01 HC048047/HL/NHLBI NIH HHS/United States
- ImNIH/Intramural NIH HHS/United States
- R01 AG020098/AG/NIA NIH HHS/United States
- U01-HG-004729/HG/NHGRI NIH HHS/United States
- 5K01DK082729-02/DK/NIDDK NIH HHS/United States
- HHSN268201100005C/HL/NHLBI NIH HHS/United States
- R01 HL071205/HL/NHLBI NIH HHS/United States
- DK063491/DK/NIDDK NIH HHS/United States
- HHSN268201100009C/HL/NHLBI NIH HHS/United States
- N01 HC048050/HL/NHLBI NIH HHS/United States
- HHSN268201100007I/HL/NHLBI NIH HHS/United States
- N01-HC-85079/HC/NHLBI NIH HHS/United States
- HL080295/HL/NHLBI NIH HHS/United States
- K01 DK082729/DK/NIDDK NIH HHS/United States
- R01HL071259/HL/NHLBI NIH HHS/United States
- N01-HC-48048/HC/NHLBI NIH HHS/United States
- R01HL071251/HL/NHLBI NIH HHS/United States
- N01 HC075150/HL/NHLBI NIH HHS/United States
- R01 HL087641/HL/NHLBI NIH HHS/United States
- R01HL071258/HL/NHLBI NIH HHS/United States
- R01 AG027058/AG/NIA NIH HHS/United States
- 263 MD 9164/MD/NIMHD NIH HHS/United States
- N01 HC045133/HC/NHLBI NIH HHS/United States
- R01HL071051/HL/NHLBI NIH HHS/United States
- R01 HL071258/HL/NHLBI NIH HHS/United States
- N01 HC035129/HC/NHLBI NIH HHS/United States
LinkOut - more resources
Full Text Sources
Other Literature Sources
Medical
Molecular Biology Databases
Research Materials
