

The active human gut microbiota differs from the total microbiota
- PMID: 21829462
- PMCID: PMC3145646
- DOI: 10.1371/journal.pone.0022448
The active human gut microbiota differs from the total microbiota
Abstract
The human gut microbiota is considered one of the most fascinating reservoirs of microbial diversity hosting between 400 to 1000 bacterial species distributed among nine phyla with Firmicutes, Bacteroidetes and Actinobacteria representing around 75% of the diversity. One of the most intriguing issues relates to understanding which microbial groups are active players in the maintenance of the microbiota homeostasis.Here, we describe the diversity of active microbial fractions compared with the whole community from raw human fecal samples. We studied four healthy volunteers by 16S rDNA gene pyrosequencing. The fractions were obtained by cell sorting based on bacterial RNA concentration. Bacterial families were observed to appear or disappear on applying a cell sorting method in which flow cytometry was used to evaluate the active cells by pyronin-Y staining of RNA. This method was able to detect active bacteria, indicating that the active players differed from that observed in raw fecal material. Generally, observations showed that in the active fractions, the number of reads related to Bacteroidetes decreased whereas several families from Clostridiales (Firmicutes) were more highly represented. Moreover, a huge number of families appeared as part of the active fraction when cell sorting was applied, indicating reads that are simply statistically hidden by the total reads.
Conflict of interest statement
Figures
 ” defines the threshold used to define the two categories of URB and ORB.
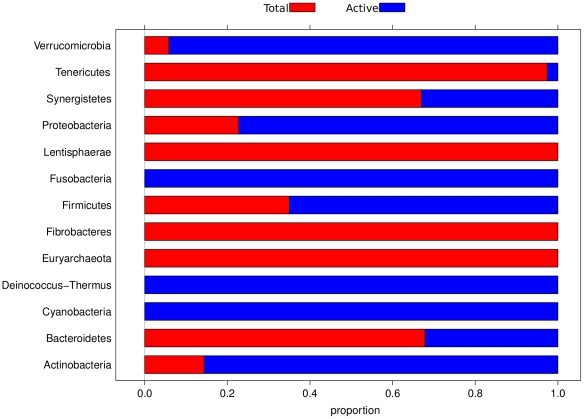
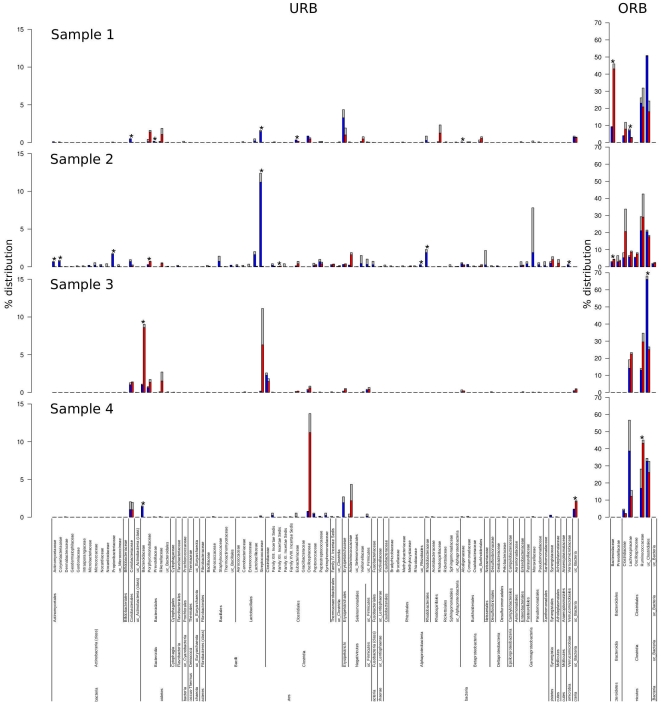
 , left) and overrepresented (more than
  right) families. Blue and red bars describe median distribution of active (HC plus LC and PA fractions) and total (FS and R fraction) respectively. Gray bars indicate the maximum values for each family. Asterisks indicate statistically significant difference (p-value
 = 0.05) between active and total fractions (abbreviations as in Figure 1).
References
-
- Stark PL, Lee A. The microbial ecology of the large bowel of breast-fed and formula-fed infants during the first year of life. J Med Microbiol. 1982;15:189–203. - PubMed
Publication types
MeSH terms
Substances
LinkOut - more resources
Full Text Sources
Other Literature Sources
Medical
