

Comprehensive phylogenetic reconstruction of amoebozoa based on concatenated analyses of SSU-rDNA and actin genes
- PMID: 21829512
- PMCID: PMC3145751
- DOI: 10.1371/journal.pone.0022780
Comprehensive phylogenetic reconstruction of amoebozoa based on concatenated analyses of SSU-rDNA and actin genes
Abstract
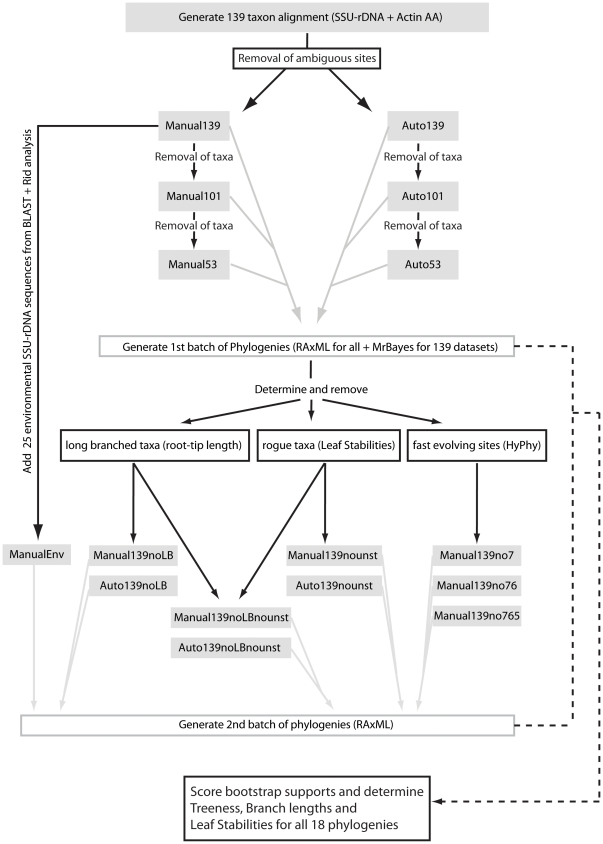
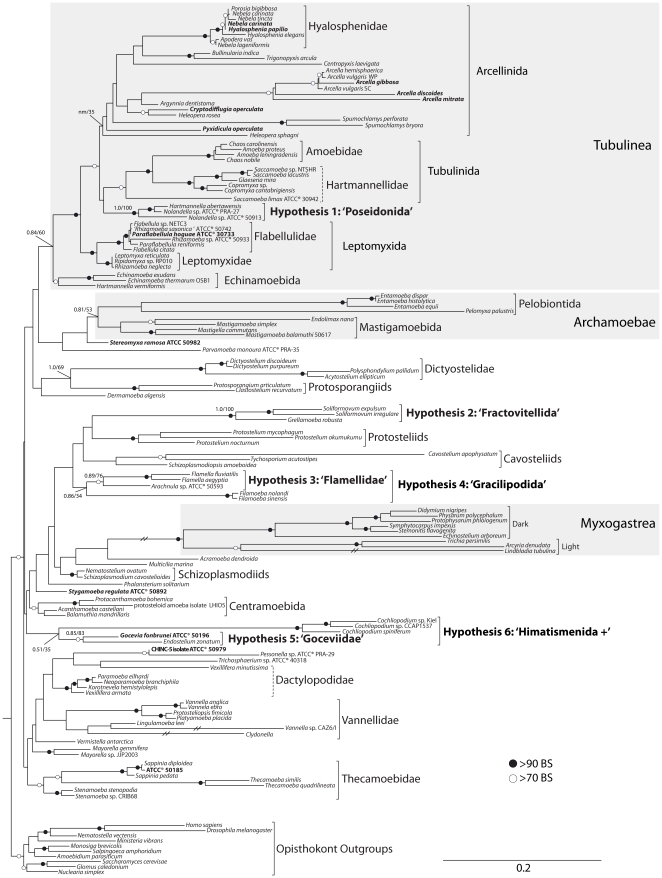
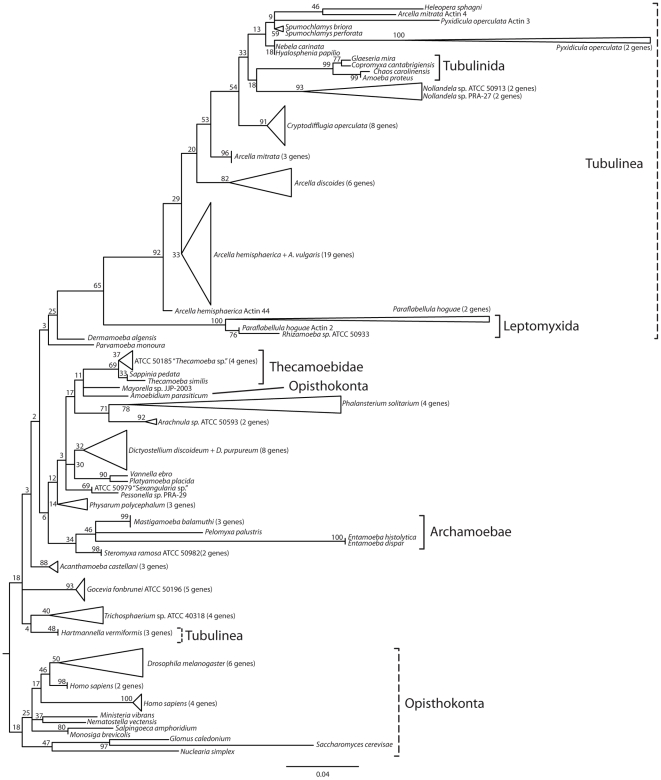
Evolutionary relationships within Amoebozoa have been the subject of controversy for two reasons: 1) paucity of morphological characters in traditional surveys and 2) haphazard taxonomic sampling in modern molecular reconstructions. These along with other factors have prevented the erection of a definitive system that resolves confidently both higher and lower-level relationships. Additionally, the recent recognition that many protosteloid amoebae are in fact scattered throughout the Amoebozoa suggests that phylogenetic reconstructions have been excluding an extensive and integral group of organisms. Here we provide a comprehensive phylogenetic reconstruction based on 139 taxa using molecular information from both SSU-rDNA and actin genes. We provide molecular data for 13 of those taxa, 12 of which had not been previously characterized. We explored the dataset extensively by generating 18 alternative reconstructions that assess the effect of missing data, long-branched taxa, unstable taxa, fast evolving sites and inclusion of environmental sequences. We compared reconstructions with each other as well as against previously published phylogenies. Our analyses show that many of the morphologically established lower-level relationships (defined here as relationships roughly equivalent to Order level or below) are congruent with molecular data. However, the data are insufficient to corroborate or reject the large majority of proposed higher-level relationships (above the Order-level), with the exception of Tubulinea, Archamoebae and Myxogastrea, which are consistently recovered. Moreover, contrary to previous expectations, the inclusion of available environmental sequences does not significantly improve the Amoebozoa reconstruction. This is probably because key amoebozoan taxa are not easily amplified by environmental sequencing methodology due to high rates of molecular evolution and regular occurrence of large indels and introns. Finally, in an effort to facilitate future sampling of key amoebozoan taxa, we provide a novel methodology for genome amplification and cDNA extraction from single or a few cells, a method that is culture-independent and allows both photodocumentation and extraction of multiple genes from natural samples.
Conflict of interest statement
Figures
Similar articles
-
Multigene phylogenetic reconstruction of the Tubulinea (Amoebozoa) corroborates four of the six major lineages, while additionally revealing that shell composition does not predict phylogeny in the Arcellinida.Protist. 2013 May;164(3):323-39. doi: 10.1016/j.protis.2013.02.003. Epub 2013 Mar 13. Protist. 2013. PMID: 23499265
-
Phylogenetic placement of diverse amoebae inferred from multigene analyses and assessment of clade stability within 'Amoebozoa' upon removal of varying rate classes of SSU-rDNA.Mol Phylogenet Evol. 2008 Apr;47(1):339-52. doi: 10.1016/j.ympev.2007.11.015. Epub 2007 Dec 3. Mol Phylogenet Evol. 2008. PMID: 18180171
-
Uncovering Cryptic Diversity in Two Amoebozoan Species Using Complete Mitochondrial Genome Sequences.J Eukaryot Microbiol. 2016 Jan-Feb;63(1):112-22. doi: 10.1111/jeu.12253. Epub 2015 Aug 28. J Eukaryot Microbiol. 2016. PMID: 26211788
-
Untangling the phylogeny of amoeboid protists.J Eukaryot Microbiol. 2009 Jan-Feb;56(1):16-25. doi: 10.1111/j.1550-7408.2008.00379.x. J Eukaryot Microbiol. 2009. PMID: 19335771 Review.
-
Vannella primoblina n. sp. - an unusual species of the genus Vannella (Amoebozoa, Discosea, Vannellida) with pronounced dorsal ridges and folds.Eur J Protistol. 2021 Feb;77:125757. doi: 10.1016/j.ejop.2020.125757. Epub 2020 Nov 20. Eur J Protistol. 2021. PMID: 33307358 Review.
Cited by
-
Marine amoebae with cytoplasmic and perinuclear symbionts deeply branching in the Gammaproteobacteria.Sci Rep. 2015 Aug 25;5:13381. doi: 10.1038/srep13381. Sci Rep. 2015. PMID: 26303516 Free PMC article.
-
Old lineages in a new ecosystem: diversification of arcellinid amoebae (Amoebozoa) and peatland mosses.PLoS One. 2014 Apr 24;9(4):e95238. doi: 10.1371/journal.pone.0095238. eCollection 2014. PLoS One. 2014. PMID: 24762929 Free PMC article.
-
Between a Pod and a Hard Test: The Deep Evolution of Amoebae.Mol Biol Evol. 2017 Sep 1;34(9):2258-2270. doi: 10.1093/molbev/msx162. Mol Biol Evol. 2017. PMID: 28505375 Free PMC article.
-
Horizontal transfer and evolution of prokaryote transposable elements in eukaryotes.Genome Biol Evol. 2013;5(5):822-32. doi: 10.1093/gbe/evt057. Genome Biol Evol. 2013. PMID: 23563966 Free PMC article.
-
Evolutionary analysis of the ENTH/ANTH/VHS protein superfamily reveals a coevolution between membrane trafficking and metabolism.BMC Genomics. 2012 Jul 2;13:297. doi: 10.1186/1471-2164-13-297. BMC Genomics. 2012. PMID: 22748146 Free PMC article.
References
-
- Pawlowski J. The twilight of Sarcodina: a molecular perspective on the polyphyletic origin of amoeboid protists. Protistology. 2008;5:22.
-
- Smirnov A, Brown S. Guide to the methods of study and identification of soil gymnamoebae. Protistology. 2004;3:148–190.
-
- Page FC. The Classification of Naked Amebas (Phylum-Rhizopoda). Archiv Fur Protistenkunde. 1987;133:199–217.
-
- Bovee EC. Class Lobosea, Carpenter 1861. In: Lee JJ, Hutner SH, Bovee EC, editors. An illustrated guide to the Protozoa. Lawrence, Kansas: Society of Protozoologists; 1985. pp. 158–211.
-
- Cavalier-Smith T. A revised six-kingdom system of life. Biological Reviews. 1998;73:203–266. - PubMed
Publication types
MeSH terms
Substances
LinkOut - more resources
Full Text Sources
Molecular Biology Databases
