. 2011;6(7):e22806.
doi: 10.1371/journal.pone.0022806. Epub 2011 Jul 29.

The role of the p38 MAPK signaling pathway in high glucose-induced epithelial-mesenchymal transition of cultured human renal tubular epithelial cells

Affiliations

The role of the p38 MAPK signaling pathway in high glucose-induced epithelial-mesenchymal transition of cultured human renal tubular epithelial cells

Zhi-Mei Lv et al. PLoS One. 2011.

Abstract

Background: Epithelial-mesenchymal transition of tubular epithelial cells, which is characterized by a loss of epithelial cell characteristics and a gain of ECM-producing myofibroblast characteristics, is an essential mechanism that is involved in tubulointerstitial fibrosis, an important component of the renal injury that is associated with diabetic nephropathy. Under diabetic conditions, p38 MAPK activation has been reported in glomeruli and mesangial cells; however, studies on p38 MAPK in TECs are lacking. In this study, the role of p38 MAPK in AP-1 activation and in the EMT in the human proximal tubular epithelial cell line (HK-2) under high glucose concentration conditions is investigated.

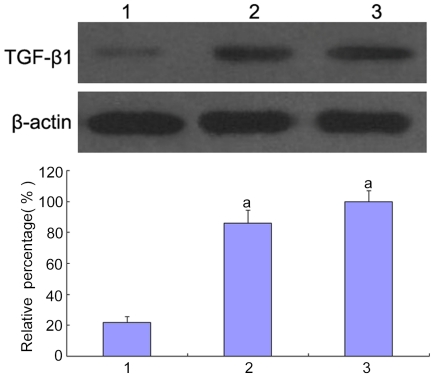
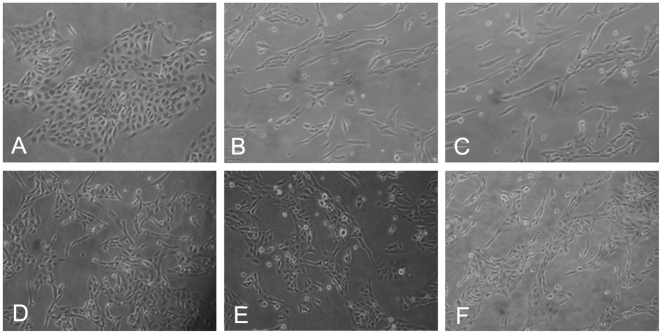
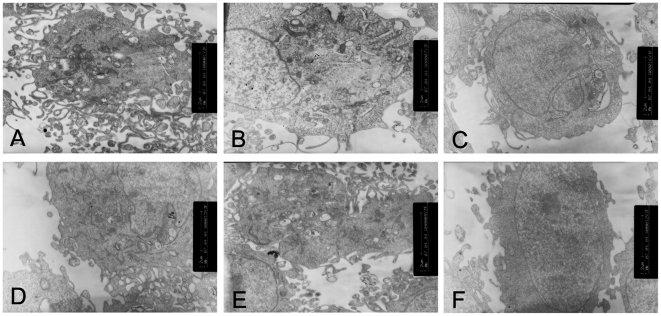
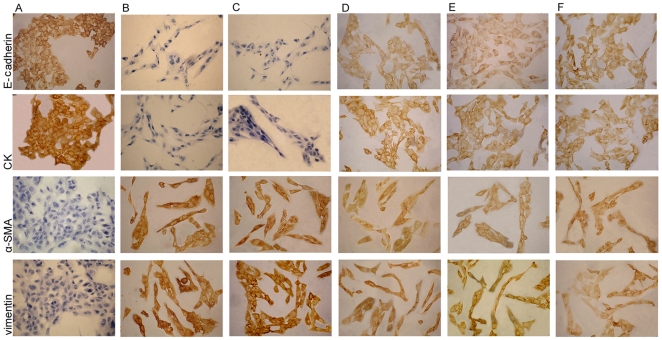
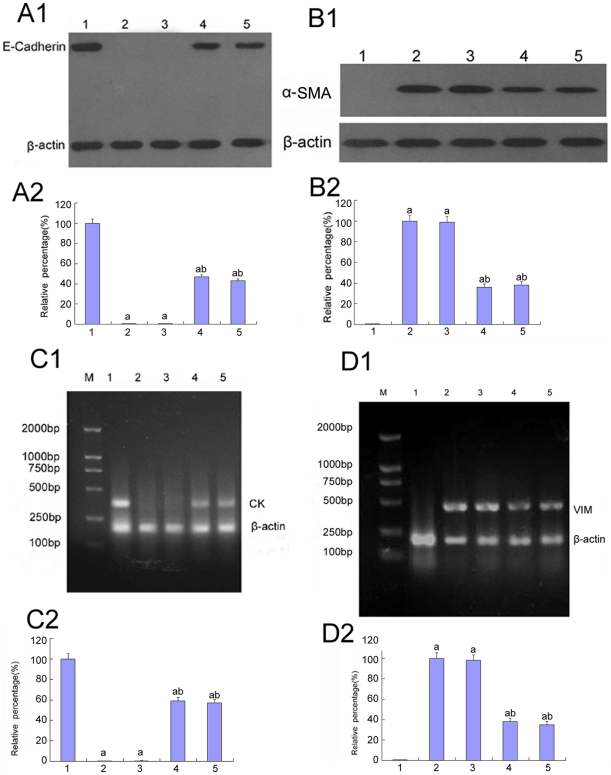
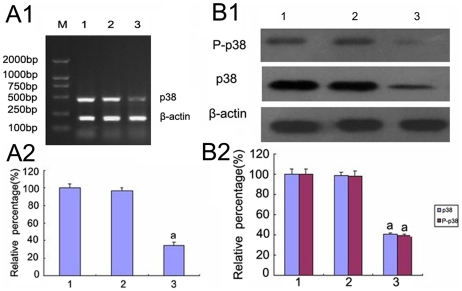
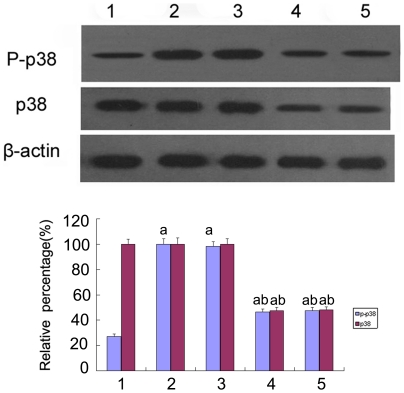
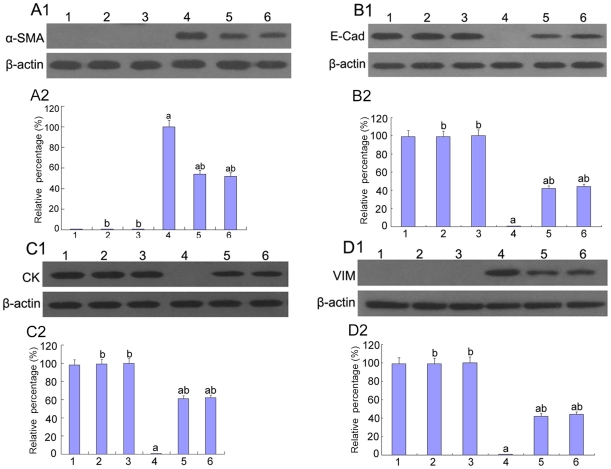
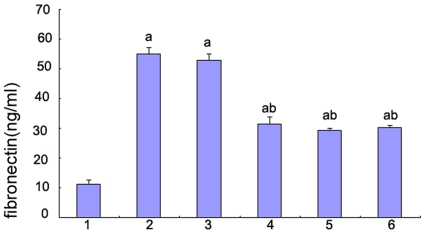
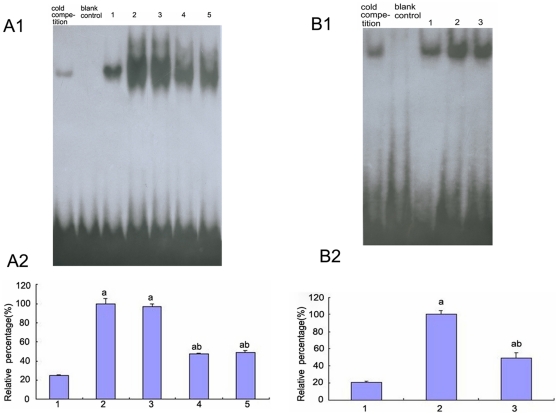
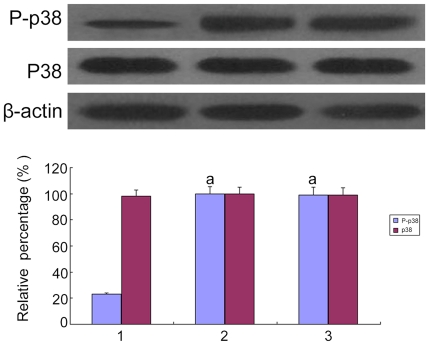
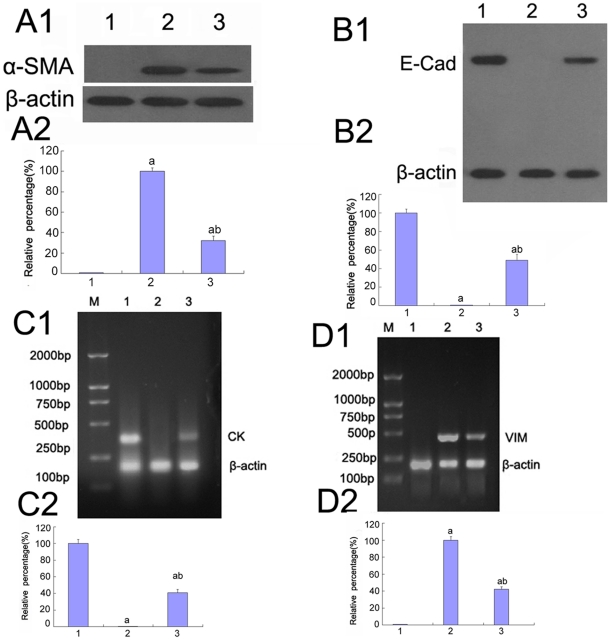
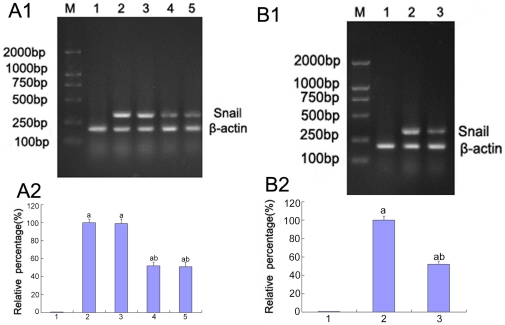
Methodology/principal findings: A vector for small interfering RNA that targets p38 MAPK was constructed; the cells were then either transfected with p38 siRNA or pretreated with a chemical inhibitor of AP-1 and incubated with low glucose plus TGF-β1 or high glucose for 48 h. Cells that were not transfected or pretreated and were exposed to low glucose with or without TGF-β1 or high glucose for 48 h were considered to be the controls. We found that high glucose induced an increase in TGF-β1. And high glucose-induced p38 MAPK activation was inhibited by p38 siRNA (P<0.05). A significant decline in E-cadherin and CK expression and a notable increase in vimentin and α-SMA were detected when exposed to low glucose with TGF-β1 or high glucose, and a significant raise of secreted fibronectin were detected when exposed to high glucose; whereas these changes were reversed when the cells were treated with p38 siRNA or AP-1 inhibitor (P<0.05). AP-1 activity levels and Snail expression were up-regulated under high glucose conditions but were markedly down-regulated through knockdown of p38 MAPK with p38 siRNA or pretreatment with AP-1 inhibitor (P<0.05).

Conclusion: This study suggests that p38 MAPK may play an important role in the high glucose-induced EMT by activating AP-1 in tubular epithelial cells.


Conflict of interest statement

Competing Interests: The authors have declared that no competing interests exist.

Figures

Figure 1
Figure 1. The expression of TGF-β1 in HK-2 cells by Western blot.
TGF-β1 was measured by Western blot of the HK-2 cells cultured in 5.5 mM glucose (lane 1), 30 mM glucose for 24 h (lane 2), 30 mM glucose for 48 h (lane 3). aP<0.05 vs. 5.5 mM glucose.
Figure 2
Figure 2. Inverted microscope analysis of the HK-2 cells cultured under different conditions.
(A) A typical epithelial cuboidal shape of the HK-2 cells cultured in 5.5 mM glucose condition were shown, with the characteristic cobblestone morphology. (B–C)Morphological changes of the HK-2 cells. The cells became more elongated, less adhered and lost their apical-to-basal polarity after treated with 30 mM glucose(B) or 30 mM glucose+Cont siRNA(C).(D–F)Changes of the cells were reversed, which were exposed to 30 mM glucose+p38 siRNA for 24 h(D) or for 48 h(E) or 30 mM glucose+AP-1 inhibitor(F).
Figure 3
Figure 3. Transmission electron microscopic analysis of the HK-2 cells cultured under different conditions.
(A–C)The HK-2 cells under 30 mM glucose (B) or 30 mM glucose+Cont siRNA (C) showed decreased number of microvilli, mitochondria and increased volume density of rough endoplasmic reticulum compared to that of the cells cultured in 5.5 mM glucose(A). (D–F)Changes of the cells were reversed,which were cultured in the 30 mM glucose+p38 siRNA for 24 h(D) or 48 h(E) or 30 mM glucose+AP-1 inhibitor(F).
Figure 4
Figure 4. Expression of E-cadherin, CK, α-SMA, vimentin in HK-2 cells by immunochemistry.
(A–C)The HK-2 cells under 30 mM glucose(B) or 30 mM glucose+cont siRNA(C) showed a loss of CK and E-cadherin and an increase of α-SMA and vimentin expression compared to that of the cells under 5.5 mM glucose condition(A).(D–F)These changes were prevented by exposed to 30 mM glucose+p38siRNA for 24 h(D) or 48 h(E) or+AP-1 inhibitor(F).
Figure 5
Figure 5. Expression of E-cadherin, CK, α-SMA, vimentin in HK-2 cells by Western blot and RT-PCR analysis.
(A–B)E-cadherin expression(A1,A2) and α-SMA(B1,B2) were analyzed by Western blot of the HK-2 cells cultured in 5.5 mM glucose (lane 1), 30 mM glucose (lane 2), 30 mM glucose+Cont siRNA(lane 3), 30 mM glucose+p38 siRNA for 24 h(lane 4), 30 mM glucose+p38 siRNA for 48 h(lane 5).(C–D)mRNA of CK (C1,C2) and vimentin(D1,D2) were analyzed by RT-PCR of the HK-2 cells cultured in 5.5 mM glucose (lane 1), 30 mM glucose (lane 2), 30 mM glucose+Cont siRNA(lane 3), 30 mM glucose+p38 siRNA for 24 h(lane 4), 30 mM glucose+p38 siRNA for 48 h(lane 5).Values represent the mean ± SD, aP<0.05 vs. 5.5 mM glucose, bP<0.05 vs. 30 mM glucose.
Figure 6
Figure 6. Effect of knockdown of p38MAPK by p38 MAPK siRNA on p38 MAPK expression by Western blot and RT-PCR analysis.
(A)P38 MAPK expression were determined by RT-PCR of the HK-2 cells cultured for 72 h in 5.5 mM glucose (lane 1), 5.5 mM glucose+Cont siRNA (lane 2), 5.5 mM glucose+p38 siRNA (lane 3). (B)P38 MAPK expression were determined by Western blot of the HK-2 cells cultured for 72 h in 5.5 mM glucose (lane 1), 5.5 mM glucose+Cont siRNA (lane 2), 5.5 mM glucose+p38 siRNA (lane 3).Values represent the mean ± SD, aP<0.05 vs. 5.5 mM glucose.
Figure 7
Figure 7. The expression of p38 MAPK and phosphorylated P38 MAPK by Western blot analysis.
p38 MAPK and phosphorylated p38 MAPK were measured by Western blot of the HK-2 cells cultured in 5.5 mM glucose (lane 1), 30 mM glucose (lane 2), 30 mM glucose+Cont siRNA(lane 3), 30 mM glucose+p38 siRNA for 24 h(lane 4), 30 mM glucose+p38 siRNA for 48 h(lane 5). Values represent the mean ± SD, aP<0.05 vs. 5.5 mM glucose, bP<0.05 vs. 30 mM glucose.
Figure 8
Figure 8. Expression of E-cadherin, CK, α-SMA, vimentin in HK-2 cells by Western blot.
(A)α-SMA, (B)E-caderin, (C)CK, (D)vimentin were measured by Western blot of the HK-2 cells cultured in 5.5 mM glucose (lane 1), 5.5 mM glucose with p38 siRNA (lane 2), 5.5 mM glucose with AP-1 inhibitor (lane 3), 5.5 mM glucose+TGF-β1 (10 ng/ml) (lane 4), 5.5 mM glucose+TGF-β1(10 ng/ml) with p38 siRNA (lane 5), 5.5 mM glucose+TGF-β1(10 ng/ml) with the AP-1 inhibitor (lane 6). aP<0.05 vs. 5.5 mM glucose, bP<0.05 vs. 5.5 mM glucose+TGF-β1.
Figure 9
Figure 9. Fibronectin synthesis in HK-2 cells by ELISA.
Fibronectin was measured by ELISA of the HK-2 cells in 5.5 mM glucose (lane 1), 30 mM glucose(lane 2), 30 mM glucose+Cont siRNA(lane 3), 30 mM glucose+p38 siRNA for 24 h(lane 4), 30 mM glucose+p38 siRNA for 48 h(lane 5) and 30 mM glucose+AP-1 inhibitor(lane 6). Values represent the mean ± SD, aP<0.05 vs. 5.5 mM glucose, bP<0.05 vs. 30 mM glucose.
Figure 10
Figure 10. Activity of AP-1 in HK-2 cells by EMSA.
(A)AP-1 activity was analyzed by EMSA of the HK-2 cells cultured in 5.5 mM glucose (lane 1), 30 mM glucose(lane 2), 30 mM glucose+Cont siRNA(lane 3), 30 mM glucose+p38 siRNA for 24 h (lane 4), 30 mM glucose+p38 siRNA for 48 h(lane 5).(B) AP-1 activity was analyzed by EMSA of the HK-2 cells cultured in 5.5 mM glucose(lane 1), 30 mM glucose (lane 2) and 30 mM glucose+AP-1 inhibitor(lane 3). Values represent the mean ± SD, aP<0.05 vs. 5.5 mM glucose, bP<0.05 vs. 30 mM glucose.
Figure 11
Figure 11. Expression and phosphorylation of p38 MAPK in HK-2 cells by Western blot.
Expression and phosphorylation of p38 MAPK under 5.5 mM glucose (lane 1), 30 mM glucose(lane 2) and 30 mM glucose+AP-1 inhibitor were determined by. aP<0.05 vs. 5.5 mM glucose.
Figure 12
Figure 12. Expression of E-cadherin, CK, α-SMA, vimentin in HK-2 cells by Western blot and RT-PCR analysis.
(A–B)α-SMA(A) and E-cadherin(B) were detected by Western blot of the HK-2 cells incubated in 5.5 mM glucose (lane 1), 30 mM glucose(lane 2), 30 mM glucose+AP-1 inhibitor(lane 3).(C–D)mRNA of CK(C) and vimentin(D) was measured by RT-PCR of the HK-2 cells incubated in 5.5 mM glucose (lane 1), 30 mM glucose(lane 2), 30 mM glucose+AP-1 inhibitor(lane 3). Values represent the mean ± SD. aP<0.05 vs. 5.5 mM glucose, bP<0.05 vs. 30 mM glucose.
Figure 13
Figure 13. The expression of Snail mRNA in HK-2 cells by RT-PCR.
(A)The levels of Snail mRNA were detected by RT-PCR of the HK-2 cells cultured in 5.5 mM glucose (lane 1), 30 mM glucose (lane 2), 30 mM glucose+Cont siRNA (lane 3), 30 mM glucose+p38 siRNA for 24 h (lane 4), 30 mM glucose DMEM+p38 siRNA for 48 h(lane 5).(B)The levels of the Snail mRNA were detected by RT-PCR of the HK-2 cells incubated in 5.5 mM glucose (lane 1), 30 mM glucose (lane 2), and 30 mM glucose+AP-1 inhibitor (lane 3). Values represent the mean ± SD, aP<0.05 vs. 5.5 mM glucose, bP<0.05 vs. 30 mM glucose.

References

    1. Zeisberg M, Kalluri R. The role of epithelial-to-mesenchymal transition in renal fibrosis. J Mol Med. 2004;82:175–181. - PubMed
    1. Masayuki I, David P, Theodore MD, Chengsen X, Hirokazu O, et al. Evidence that fibroblasts derive from epithelium during tissue fibrosis. J Clin Invest. 2002;110:341–350. - PMC - PubMed
    1. Zeisberg M, Strutz F, Muller GA. Role of fibroblast activation in inducing interstitial fibrosis. J Nephrol. 2000;13:111–120. - PubMed
    1. Yang J, Liu Y. Dissection of key events in tubular epithelial to myofibroblast transition and is implications in renal interstitial fibrosis. Am J Pathol. 2001;159:1465–1475. - PMC - PubMed
    1. Massagúe J. TGF-β Signal Tranduction. Annu Rev Biochem. 1998;67:753–791. - PubMed

Publication types

MeSH terms