. 2011;6(7):e22953.
doi: 10.1371/journal.pone.0022953. Epub 2011 Jul 29.

Differential gene expression in the siphonophore Nanomia bijuga (Cnidaria) assessed with multiple next-generation sequencing workflows

Affiliations

Differential gene expression in the siphonophore Nanomia bijuga (Cnidaria) assessed with multiple next-generation sequencing workflows

Stefan Siebert et al. PLoS One. 2011.

Abstract

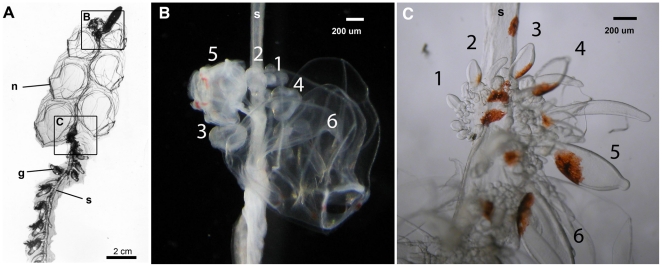
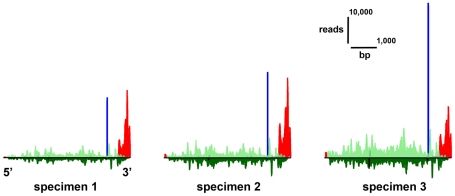
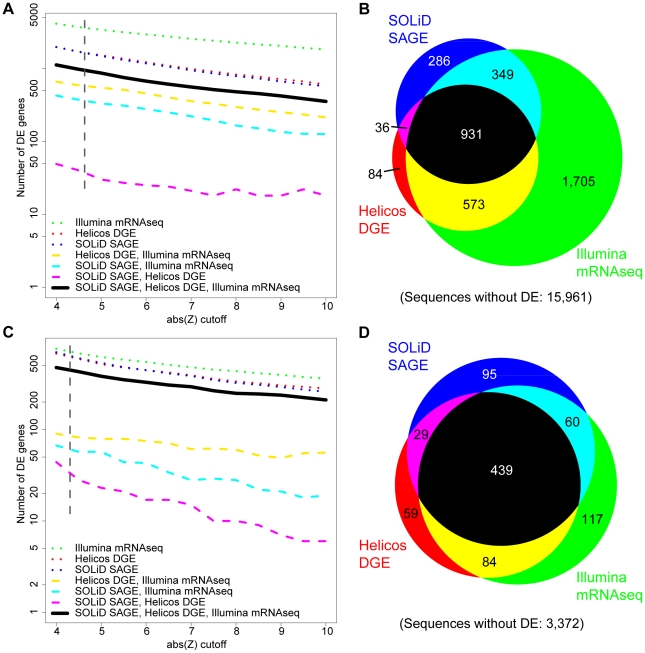
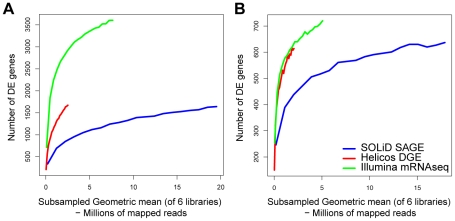
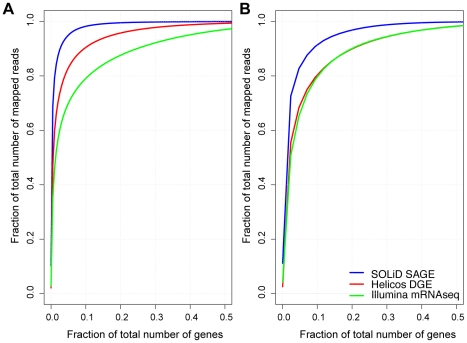
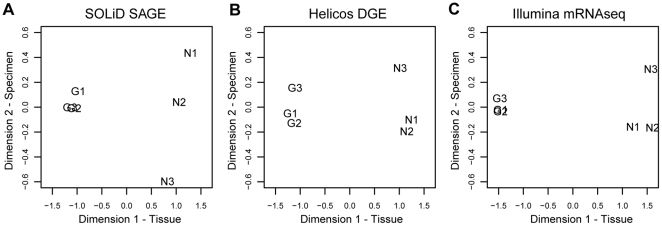
We investigated differential gene expression between functionally specialized feeding polyps and swimming medusae in the siphonophore Nanomia bijuga (Cnidaria) with a hybrid long-read/short-read sequencing strategy. We assembled a set of partial gene reference sequences from long-read data (Roche 454), and generated short-read sequences from replicated tissue samples that were mapped to the references to quantify expression. We collected and compared expression data with three short-read expression workflows that differ in sample preparation, sequencing technology, and mapping tools. These workflows were Illumina mRNA-Seq, which generates sequence reads from random locations along each transcript, and two tag-based approaches, SOLiD SAGE and Helicos DGE, which generate reads from particular tag sites. Differences in expression results across workflows were mostly due to the differential impact of missing data in the partial reference sequences. When all 454-derived gene reference sequences were considered, Illumina mRNA-Seq detected more than twice as many differentially expressed (DE) reference sequences as the tag-based workflows. This discrepancy was largely due to missing tag sites in the partial reference that led to false negatives in the tag-based workflows. When only the subset of reference sequences that unambiguously have tag sites was considered, we found broad congruence across workflows, and they all identified a similar set of DE sequences. Our results are promising in several regards for gene expression studies in non-model organisms. First, we demonstrate that a hybrid long-read/short-read sequencing strategy is an effective way to collect gene expression data when an annotated genome sequence is not available. Second, our replicated sampling indicates that expression profiles are highly consistent across field-collected animals in this case. Third, the impacts of partial reference sequences on the ability to detect DE can be mitigated through workflow choice and deeper reference sequencing.


Conflict of interest statement

Competing Interests: The authors have declared that no competing interests exist.

Figures

Figure 1
Figure 1. Tissues sampled from the siphonophore Nanomia bijuga.
(A) Paired samples of young nectophores (B) and young gastrozooids (C) were removed from each of three remotely operated vehicle-collected specimens (see video S1). n: nectophore, g: gastrozooid, s: stem of the colony. Frames in (A ) indicate regions shown in (B ) and (C ). Numbers indicate the sampled zooids.
Figure 2
Figure 2. Physical distribution of mapped short-read sequences across an example transcript.
Read distribution is shown for a fibrillar collagen (isogroup06489, tblastx e-value 1e-87) for the three nectophore samples. Gastrozooid expression was much lower and not visible on the same scale. All three short-read workflows found significant differential expression for this gene. The gene is drawn in the 5′–3′ direction (4,864 bp). Height of the colored bars indicates the number of reads mapped to that location. Count data are not normalized, so differences in amplitude across samples can be due to differences in sequencing effort across samples. Reads above the line map in the sense direction, below the line in the antisense direction. Helicos DGE reads (red) are sense and unexpectedly tended to map to the 3′ end. Illumina mRNA-Seq reads (green) map to sense and antisense strand along the whole gene. The largest stack of reads for SOliD SAGE (blue) is adjacent to the 3′-most NlaIII cutting site.
Figure 3
Figure 3. The number and overlap across platforms of reference sequences identified to have differential expression (DE).
Analyses of all reference sequences (A, B) and analyses of the subset of sequences with the 3′-most NlaIII site (C, D). (A, C) The effect of the Z threshold on the number of genes found to have differential gene expression. The relatively flat lines in all cases indicate little sensitivity to Z threshold. (B) Proportional Venn diagram of the number of sequences with significant differential expression (Z>4.71) in analyses of all reference sequences. (D) Proportional Venn diagram of the number of sequences with significant differential expression (Z>4.38) in analyses of the subset of sequences with the primary tag site. Areas in Venn diagrams are approximate. Dashed lines in A,C indicate Z-values used in B, D. The same color code applies to all figures.
Figure 4
Figure 4. Accumulation curves indicating the number of genes with significant differential expression (DE) when short reads are subsampled.
Number of DE sequences are plotted against subsampled library sizes considering the full reference (A) and the subset of sequences with the 3′-most NlaIII site (B). This enables comparison of significance across equivalent library sizes.
Figure 5
Figure 5. The cumulative fraction of total mapped reads across reference sequences.
Fractions of mapped reads are shown for all reference sequences (A) and the subset of sequences with the 3′-most NlaIII site (B). Genes are sorted along the x axis in descending order of the number of mapped reads.
Figure 6
Figure 6. Differential expression across samples from different specimen in different workflows (A–C).
Multidimensional scaling plots indicate low degrees of differential expression between samples of the same tissue type originating from different specimen (dimension 2) and higher degrees of differential expression when comparing different tissues types (dimension 1). N: nectophore sample, G: gastrozooid sample. The full set of reference sequences was considered.
Figure 7
Figure 7. In situ characterisation of gene expression.
Expression analysis of isogroup03256 in developing nectophores (A) and gastrozooids (B). The transcript is localized in the basigaster, a region associated with nematogenesis, at the base of gastrozooids and detectable in very early stages of gastrozooid development (arrow). (C) Sense control with an unstained basigaster region. In situ hybridizations for nectophore specific transcripts have been performed successfully (data not shown). S: stem of the colony, b: basigaster region of the gastrozooid, pn: pneumatophore.

References

    1. Mackie GO, editor. The Lower Metazoa: University of California Press; 1963. pp. 329–337.
    1. Mackie GO, Pugh PR, Purcell JE. Siphonophore Biology. Adv Mar Biol. 1987;24:97–262.
    1. Dunn C. Siphonophores. Current Biology. 2009;19:R233–R234. - PubMed
    1. Dunn CW, Wagner GP. The evolution of colony-level development in the Siphonophora (Cnidaria : Hydrozoa). Development Genes and Evolution. 2006;216:743–754. - PubMed
    1. Harbers M, Carninci P. Tag-based approaches for transcriptome research and genome annotation. Nature Methods. 2005;2:495–502. - PubMed

Publication types