Randomized Controlled Trial
. 2011;6(7):e23035.
doi: 10.1371/journal.pone.0023035. Epub 2011 Jul 28.

Intestinal microbiota in healthy adults: temporal analysis reveals individual and common core and relation to intestinal symptoms

Affiliations
Randomized Controlled Trial

Intestinal microbiota in healthy adults: temporal analysis reveals individual and common core and relation to intestinal symptoms

Jonna Jalanka-Tuovinen et al. PLoS One. 2011.

Abstract

Background: While our knowledge of the intestinal microbiota during disease is accumulating, basic information of the microbiota in healthy subjects is still scarce. The aim of this study was to characterize the intestinal microbiota of healthy adults and specifically address its temporal stability, core microbiota and relation with intestinal symptoms. We carried out a longitudinal study by following a set of 15 healthy Finnish subjects for seven weeks and regularly assessed their intestinal bacteria and archaea with the Human Intestinal Tract (HIT) Chip, a phylogenetic microarray, in conjunction with qPCR analyses. The health perception and occurrence of intestinal symptoms was recorded by questionnaire at each sampling point.

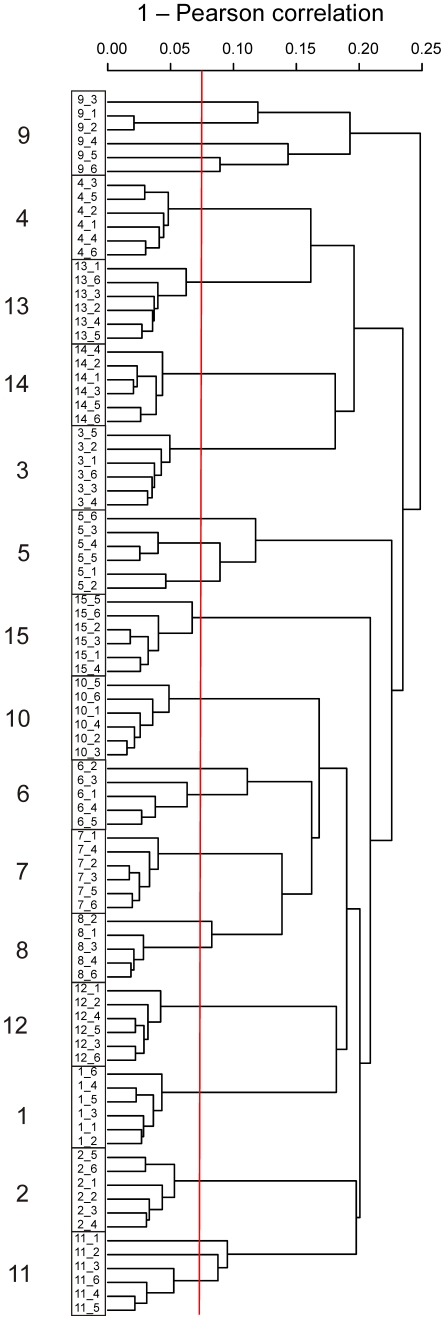
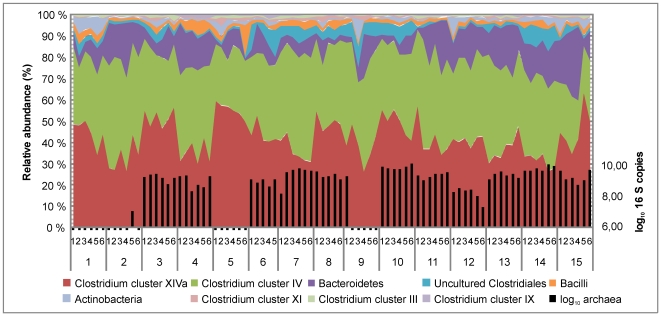
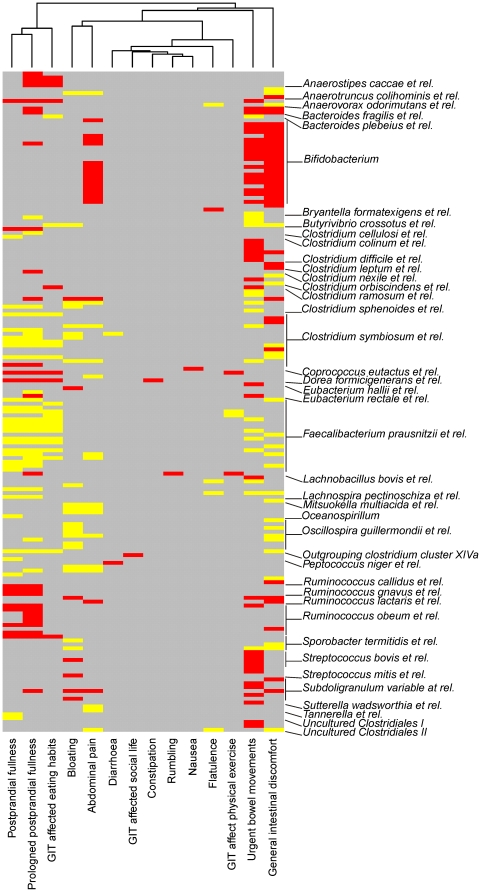
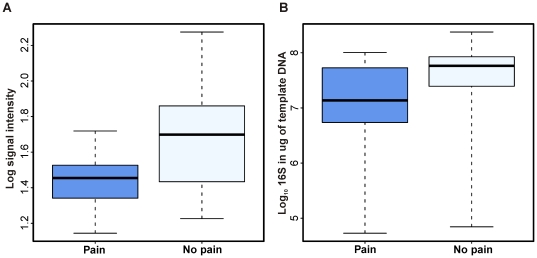
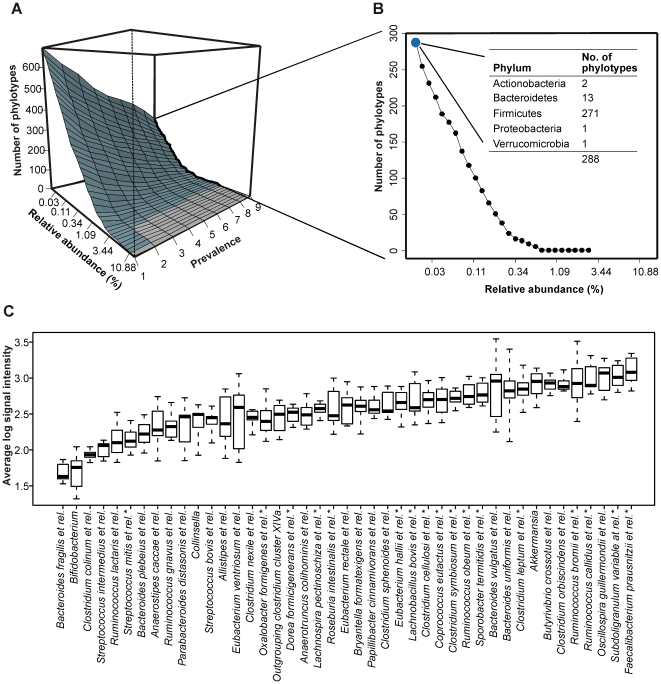
Principal findings: A high overall temporal stability of the microbiota was observed. Five subjects showed transient microbiota destabilization, which correlated not only with the intake of antibiotics but also with overseas travelling and temporary illness, expanding the hitherto known factors affecting the intestinal microbiota. We identified significant correlations between the microbiota and common intestinal symptoms, including abdominal pain and bloating. The most striking finding was the inverse correlation between Bifidobacteria and abdominal pain: subjects who experienced pain had over five-fold less Bifidobacteria compared to those without pain. Finally, a novel computational approach was used to define the common core microbiota, highlighting the role of the analysis depth in finding the phylogenetic core and estimating its size. The in-depth analysis suggested that we share a substantial number of our intestinal phylotypes but as they represent highly variable proportions of the total community, many of them often remain undetected.

Conclusions/significance: A global and high-resolution microbiota analysis was carried out to determine the temporal stability, the associations with intestinal symptoms, and the individual and common core microbiota in healthy adults. The findings provide new approaches to define intestinal health and to further characterize the microbial communities inhabiting the human gut.


Conflict of interest statement

Competing Interests: One of the authors (RAK) is employed by a commercial company (Valio Ltd). This does not alter the authors' adherence to all the PLoS ONE policies on sharing data and materials, and the content of this paper was neither influenced nor constrained by that fact.

Figures

Figure 1
Figure 1. Hierarchical clustering of the HITChip profiles of 15 subjects and their six timepoints.
The subject-wise clustering is highlighted with boxes and the temporal variation is displayed with the variable length of the branches. Red vertical line is drawn at Pearson correlation of 0.925, below which the intra-individual sample similarity was detected only in the five unstable subjects (5,6,8,9 and 11) discussed in the text.
Figure 2
Figure 2. Microbiota composition of the study subjects.
Relative abundance of the phylotypes that contributed over 0.5% to the total HITChip signal was summed up to phylum level, except Firmicutes, which were summed up to class or Clostridium cluster level (left y-axis). The qPCR-based quantification of the methanogens is shown on the right y-axis.
Figure 3
Figure 3. Correlation heatmap of the microbiota profiles and intestinal symptoms.
The heatmap visualizes all significant (q-value <0.005) Spearman correlations between the intestinal symptoms and the HITChip-measured abundance of bacterial phylotypes. Each row represents a single phylotype, whose genus-level assignments are listed below the rows, or in the middle when several rows refer to the same genus-level group. The negative correlations between symptoms are indicated in red and the positive correlations with yellow; non-significant correlations are shown in gray.
Figure 4
Figure 4. Quantification of Bidifobacteria in relation to abdominal pain.
The samples were divided into two groups: with and without concurrent abdominal pain, and the abundance of Bifidobacteria in each group was determined using A. HITChip and B. qPCR. The difference between the groups was statistically significant (q≤0.02 in A; p<0.05 in B). The box extends from 25th percentile to 75th percentile, with a line at the median; the whiskers extent to the highest and lowest values.
Figure 5
Figure 5. Definition of the common core microbiota.
A. Perspective plot is used to visualize how the number of phylotypes in the common core is a function of the selected abundance and prevalence. Light gray indicates the area where no phylotypes passed the given criteria. B. The common core microbiota in the healthy subjects. The y-axis represents the range of the phylotype count shared, thus forming the common core, in the nine healthy subjects. The line visualizes how the number of the phylotypes depends on the selected percentile abundance, and how it decreases drastically when the phylotypes with lowest abundance are excluded. List shows phylum-level summary of the phylotypes that contributed with over 0.03% relative abundance C. The common core phylotypes summarized to genus-level taxa. The boxplots visualize the intra-individual variation in the abundances of the core taxa. Bacteroides fragilis et rel. and Bifidobacteria (two leftmost boxes) are visualized for reference purposes. These taxa were not part of the common core due to their large intra- and inter-individual variation. For boxplot details, please see the legend for Figure 4.

References

    1. Bäckhed F, Ley RE, Sonnenburg JL, Peterson DA, Gordon JI. Host-bacterial mutualism in the human intestine. Science (New York, NY) 2005;307:1915–1920. - PubMed
    1. Sokol H, Seksik P, Furet JP, Firmesse O, Nion-Larmurier I, et al. Low counts of Faecalibacterium prausnitzii in colitis microbiota. Inflammatory bowel diseases. 2009;15:1183–1189. - PubMed
    1. Kassinen A, Krogius-Kurikka L, Mäkivuokko H, Rinttilä T, Paulin L, et al. The fecal microbiota of irritable bowel syndrome patients differs significantly from that of healthy subjects. Gastroenterology. 2007;133:24–33. - PubMed
    1. Malinen E, Rinttilä T, Kajander K, Mättö J, Kassinen A, et al. Analysis of the fecal microbiota of irritable bowel syndrome patients and healthy controls with real-time PCR. The American Journal of Gastroenterology. 2005;100:373–382. - PubMed
    1. Larsen N, Vogensen FK, Van Den Berg FW, Nielsen DS, Andreasen AS, et al. Gut microbiota in human adults with type 2 diabetes differs from non-diabetic adults. PLoS One. 2010;5:e9085. - PMC - PubMed

Publication types

MeSH terms