Extended interferon-alpha therapy accelerates telomere length loss in human peripheral blood T lymphocytes
- PMID: 21829595
- PMCID: PMC3150344
- DOI: 10.1371/journal.pone.0020922
Extended interferon-alpha therapy accelerates telomere length loss in human peripheral blood T lymphocytes
Abstract
Background: Type I interferons have pleiotropic effects on host cells, including inhibiting telomerase in lymphocytes and antiviral activity. We tested the hypothesis that long-term interferon treatment would result in significant reduction in average telomere length in peripheral blood T lymphocytes.
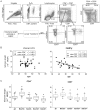
Methods/principal findings: Using a flow cytometry-based telomere length assay on peripheral blood mononuclear cell samples from the Hepatitis-C Antiviral Long-term Treatment against Cirrhosis (HALT-C) study, we measured T cell telomere lengths at screening and at months 21 and 45 in 29 Hepatitis-C virus infected subjects. These subjects had failed to achieve a sustained virologic response following 24 weeks of pegylated-interferon-alpha plus ribavirin treatment and were subsequently randomized to either a no additional therapy group or a maintenance dose pegylated-IFNα group for an additional 3.5 years. Significant telomere loss in naïve T cells occurred in the first 21 months in the interferon-alpha group. Telomere losses were similar in both groups during the final two years. Expansion of CD8(+)CD45RA(+)CD57(+) memory T cells and an inverse correlation of alanine aminotransferase levels with naïve CD8(+) T cell telomere loss were observed in the control group but not in the interferon-alpha group. Telomere length at screening inversely correlated with Hepatitis-C viral load and body mass index.
Conclusions/significance: Sustained interferon-alpha treatment increased telomere loss in naïve T cells, and inhibited the accumulation of T cell memory expansions. The durability of this effect and consequences for immune senescence need to be defined.
Trial registration: ClinicalTrials.gov NCT00006164.
Conflict of interest statement
Figures


References
-
- de Lange T. Shelterin: the protein complex that shapes and safeguards human telomeres. Genes Dev. 2005;19:2100–2110. - PubMed
-
- Hodes RJ, Hathcock KS, Weng NP. Telomeres in T and B cells. Nat Rev Immunol. 2002;2:699–706. - PubMed
-
- Xu D, Erickson S, Szeps M, Gruber A, Sangfelt O, et al. Interferon alpha down-regulates telomerase reverse transcriptase and telomerase activity in human malignant and nonmalignant hematopoietic cells. Blood. 2000;96:4313–4318. - PubMed
-
- Hirsch RL, Johnson KP. The effects of long-term administration of recombinant alpha-2 interferon on lymphocyte subsets, proliferation, and suppressor cell function in multiple sclerosis. J Interferon Res. 1986;6:171–177. - PubMed
Publication types
MeSH terms
Substances
Associated data
Grants and funding
- M01RR-00042/RR/NCRR NIH HHS/United States
- N01-DK-9-2324/DK/NIDDK NIH HHS/United States
- U19 AI057319/AI/NIAID NIH HHS/United States
- 1 UL1 RR024986/RR/NCRR NIH HHS/United States
- N01-DK-9-2321/DK/NIDDK NIH HHS/United States
- U19AI057319/AI/NIAID NIH HHS/United States
- P01 AI049320/AI/NIAID NIH HHS/United States
- M01 RR006192/RR/NCRR NIH HHS/United States
- M01 RR000633/RR/NCRR NIH HHS/United States
- UL1 RR024982/RR/NCRR NIH HHS/United States
- N01-DK-9-2326/DK/NIDDK NIH HHS/United States
- N01-DK-9-2323/DK/NIDDK NIH HHS/United States
- M01 RR000042/RR/NCRR NIH HHS/United States
- UL1 RR024986/RR/NCRR NIH HHS/United States
- 1 UL1RR024982-01/RR/NCRR NIH HHS/United States
- N01-DK-9-2325/DK/NIDDK NIH HHS/United States
- M01 RR000043/RR/NCRR NIH HHS/United States
- T32 AI007349/AI/NIAID NIH HHS/United States
- M01RR-00633/RR/NCRR NIH HHS/United States
- M01RR-00043/RR/NCRR NIH HHS/United States
- M01RR-06192/RR/NCRR NIH HHS/United States
LinkOut - more resources
Full Text Sources
Medical
Molecular Biology Databases
Research Materials

