. 2011;6(8):e22669.
doi: 10.1371/journal.pone.0022669. Epub 2011 Aug 1.

Workflow and atlas system for brain-wide mapping of axonal connectivity in rat

Affiliations

Workflow and atlas system for brain-wide mapping of axonal connectivity in rat

Izabela M Zakiewicz et al. PLoS One. 2011.

Abstract

Detailed knowledge about the anatomical organization of axonal connections is important for understanding normal functions of brain systems and disease-related dysfunctions. Such connectivity data are typically generated in neuroanatomical tract-tracing experiments in which specific axonal connections are visualized in histological sections. Since journal publications typically only accommodate restricted data descriptions and example images, literature search is a cumbersome way to retrieve overviews of brain connectivity. To explore more efficient ways of mapping, analyzing, and sharing detailed axonal connectivity data from the rodent brain, we have implemented a workflow for data production and developed an atlas system tailored for online presentation of axonal tracing data. The system is available online through the Rodent Brain WorkBench (www.rbwb.org; Whole Brain Connectivity Atlas) and holds experimental metadata and high-resolution images of histological sections from experiments in which axonal tracers were injected in the primary somatosensory cortex. We here present the workflow and the data system, and exemplify how the online image repository can be used to map different aspects of the brain-wide connectivity of the rat primary somatosensory cortex, including not only presence of connections but also morphology, densities, and spatial organization. The accuracy of the approach is validated by comparing results generated with our system with findings reported in previous publications. The present study is a contribution to a systematic mapping of rodent brain connections and represents a starting point for further large-scale mapping efforts.


Conflict of interest statement

Competing Interests: The authors have declared that no competing interests exist.

Figures

Figure 1
Figure 1. Diagrams of axonal tracing paradigm and connections of rat brain somatosensory cortex.
(A) Schematic diagram showing the principles of anterograde axonal tracing. Following injection of an anterograde axonal tracer to a brain region (I), the tracer is taken up by neurons (red dot in region I) within the injection site, and anterogradely transported along efferent axons, yielding distinctly labeled axons and terminal fields (solid lines) in regions (II, III) receiving axonal projections from the injected region. While the tracer Phaseolus vulgaris leucoagglutinin only gives anterograde labeling (solid red lines), the bidirectional tracer biotinylated dextran amine, also gives rise to retrograde labeling of neurons (red dot in region II), as well as secondary anterograde labeling of collateral axons (dashed red lines to regions II and IV). (B) Diagram of the rat brain showing axonal projections from the primary somatosensory cortex to well-known ipsilateral (solid red lines) and contralateral (dashed red lines) subcortical targets. (C) Schematic wiring diagram (modified from [31]) showing the input and output relationships of the primary somatosensory cortex (SI). SI input from the trigeminal system is shown (solid black lines). SI output connections (solid red lines) reach several cortical and subcortical regions. Grey shading indicates regions investigated in the present study (Fig. 5). CP, caudate putamen; Cb, cerebellum; MI, primary motor cortex; PN, pontine nuclei; Po, posterior complex thalamus, PR, perirhinal cortex; Rt, reticular nucleus thalamus; SI, primary somatosensory cortex; SII, secondary somatosensory cortex; SC, superior colliculus; TN, trigeminal nuclei; VB, ventrobasal complex thalamus.
Figure 2
Figure 2. Workflow.
(A) Flowchart showing four processing steps, beginning with an animal submitted to an axonal tract-tracing experiment, followed by tissue and image processing steps, to an end result consisting of section images in a database. For each step, information about experimental parameters and procedures (metadata) are stored together with the section images. (B) Diagram showing module details and the input and output elements of each module in the workflow.
Figure 3
Figure 3. Formalized overview of experimental metadata recorded for axonal tracing experiments.
Information deemed necessary for the interpretation and re-use of axonal tracing experiments, sorted according to the processing steps shown in Figure 2.
Figure 4
Figure 4. Graphical user interface of the online image repository.
(A) Viewer tool providing access to a series of images organized by bregma levels. Thumbnail images (bottom row) provide overview of the available images, and selected images can be explored in the viewer panel by interactive zooming and panning. Metadata are available via a link in the viewer. (B–D) Evaluation of injection site location. Comparison of a BDA labeled section through the injection site (B) and a neighboring section (C) showing the SI barrel architecture (cytochrome oxidase staining). (D) Overlay of (B) and (C). Arrows indicate individual cytochrome oxidase positive SI whisker barrels.
Figure 5
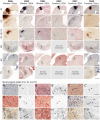
Figure 5. Overview of subcortical projections from SI whisker and forelimb representations.
Analysis of subcortical projections in six experiments with tracer injections in SI whisker or forelimb representations (row 1). Images are sorted according to animals (columns) and location (rows). Comparison within rows 2–6 demonstrates that projections from SI whisker and SI forelimb representations, respectively, have similar axonal distributions. Comparison within columns demonstrates considerable variability in the amount of labeled axons present in the different regions receiving SI projections. The bottom panels (A–I) show morphological details from regions indicated by frames in the superior colliculus (row 5) and trigeminal nuclei (row 6). Panels A′–I′ show processed images with background staining removed to facilitate visualization of labeled fibers. CP, caudate putamen; PN, pontine nuclei; Po, posterior complex thalamus, Rt, reticular nucleus thalamus; SI, primary somatosensory cortex; SC, superior colliculus; TN, trigeminal nuclei; VB, ventrobasal complex thalamus. Scale bars, 1 mm (rows 1–6) and 100 µm (A–I).
Figure 6
Figure 6. Topography of corticothalamic projections from different body part representations in primary somatosensory cortex (SI).
(A–C) Images from corresponding locations in the thalamus from three experiments, showing labeled corticothalamic axonal plexuses. Inset figures indicate the localization and extent of injection sites. (D, F) Semitransparent overlays of image panels A and B, and B and C, showing distinct topographical distribution patterns in full agreement with earlier results from dual-tracing experiments. (E) Computerized plots showing topographical distribution of corticothalamic projections following SI tracer injections, modified from and . Scale bar: 1 mm.

Similar articles

Cited by

References

    1. Albin RL, Young AB, Penney JB. The functional anatomy of basal ganglia disorders. Trends Neurosci. 1989;12:366–375. - PubMed
    1. Houk JC, Wise SP. Distributed modular architectures linking basal ganglia, cerebellum, and cerebral cortex: their role in planning and controlling action. Cereb Cortex. 1995;5:95–110. - PubMed
    1. Alexander GE, Crutcher MD, DeLong MR. Basal ganglia-thalamocortical circuits: parallel substrates for motor, oculomotor, “prefrontal” and “limbic” functions. Prog Brain Res. 1990;85:119–146. - PubMed
    1. Tekin S, Cummings JL. Frontal-subcortical neuronal circuits and clinical neuropsychiatry: an update. J Psychosom Res. 2002;53:647–654. - PubMed
    1. Saleem KS, Pauls JM, Augath M, Trinath T, Prause BA, et al. Magnetic resonance imaging of neuronal connections in the macaque monkey. Neuron. 2002;34:685–700. - PubMed

Publication types