. 2011;6(8):e22839.
doi: 10.1371/journal.pone.0022839. Epub 2011 Aug 1.

MicroRNA 144 impairs insulin signaling by inhibiting the expression of insulin receptor substrate 1 in type 2 diabetes mellitus

Affiliations

MicroRNA 144 impairs insulin signaling by inhibiting the expression of insulin receptor substrate 1 in type 2 diabetes mellitus

Dwi Setyowati Karolina et al. PLoS One. 2011.

Erratum in

  • PLoS One. 2011;6(9). doi: 10.1371/annotation/698b7123-174f-4a09-95c9-fd6f5017d622

Abstract

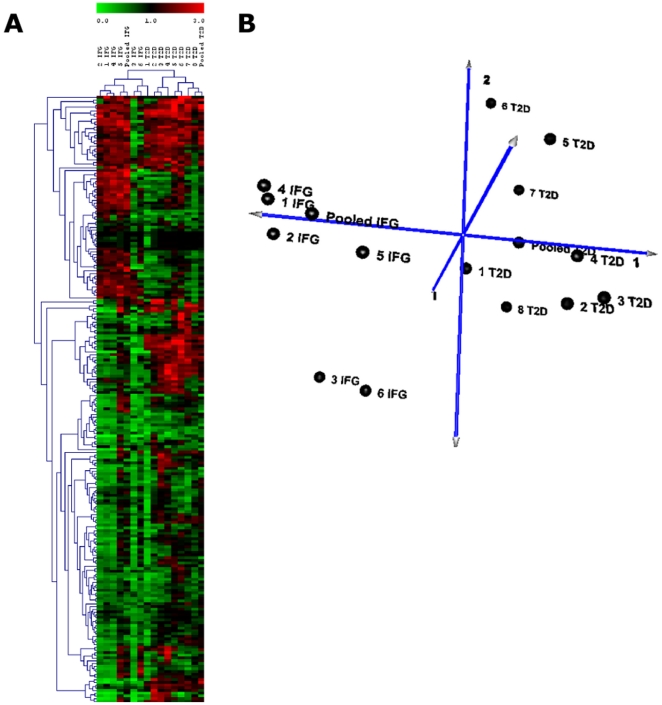
Background: Dysregulation of microRNA (miRNA) expression in various tissues and body fluids has been demonstrated to be associated with several diseases, including Type 2 Diabetes mellitus (T2D). Here, we compare miRNA expression profiles in different tissues (pancreas, liver, adipose and skeletal muscle) as well as in blood samples from T2D rat model and highlight the potential of circulating miRNAs as biomarkers of T2D. In parallel, we have examined the expression profiles of miRNAs in blood samples from Impaired Fasting Glucose (IFG) and T2D male patients.

Methodology/principal findings: Employing miRNA microarray and stem-loop real-time RT-PCR, we identify four novel miRNAs, miR-144, miR-146a, miR-150 and miR-182 in addition to four previously reported diabetes-related miRNAs, miR-192, miR-29a, miR-30d and miR-320a, as potential signature miRNAs that distinguished IFG and T2D. Of these microRNAs, miR-144 that promotes erythropoiesis has been found to be highly up-regulated. Increased circulating level of miR-144 has been found to correlate with down-regulation of its predicted target, insulin receptor substrate 1 (IRS1) at both mRNA and protein levels. We could also experimentally demonstrate that IRS1 is indeed the target of miR-144.

Conclusion: We demonstrate that peripheral blood microRNAs can be developed as unique biomarkers that are reflective and predictive of metabolic health and disorder. We have also identified signature miRNAs which could possibly explain the pathogenesis of T2D and the significance of miR-144 in insulin signaling.


Conflict of interest statement

Competing Interests: The authors have declared that no competing interests exist.

Figures

Figure 1
Figure 1. Oral glucose tolerance test (OGTT).
Serum glucose and insulin concentrations of both NFD and HFD groups upon OGTT. Data presented as mean ± SEM with n = 6 for each group. Statistically significant differences are tested at p<0.05 significance. *p<0.05, **p<0.01, ***p<0.001.
Figure 2
Figure 2. Clustering of miRNA profiles of blood and tissues of HFD rats.
A. Hierarchical clustering plot (heatmap) of miRNA distribution in blood and tissues of HFD rats (compared to controls). Only miRNAs conserved in humans with background subtracted mean signal intensities above 300 are included. Expression of blood miRNAs are clustered in the centre closely to the peripheral tissues. Data are expressed as fold change of HFD versus NFD control. Green: down-regulation; Red: up-regulation; Grey: not detected. B. Venn diagram showing the number of miRNAs with significant changes detected in blood and the different tissues (Diabetic vs controls). 84 miRNAs have been detected in all five sources.
Figure 3
Figure 3. Clustering of miRNA profiles of HFD rats and pooled T2D patients.
A. Hierarchical clustering plot (heatmap) of miRNA distribution in HFD rats and pooled blood from T2D patients. Blood samples from HFD rats and pooled T2D patients are clustered closely to one another. Data are expressed as fold change of HFD versus NFD control. Green: down-regulation; Red: up-regulation; Grey: not detected. B. Principal component analysis (PCA) showed similar clustering as heatmap.
Figure 4
Figure 4. Clustering of miRNA profiles of IFG and T2D patients (Batch A).
A. Hierarchical clustering plot (heatmap) of miRNA distribution in IFG and T2D patients. Only miRNAs with background subtracted mean signal intensities above 300 are included. Data are expressed as fold change of case versus healthy control. Green: down-regulation; Red: up-regulation; Grey: not detected. B. Principal component analysis (PCA) plot showed a distinguished distribution of IFG and T2D patients based on miRNA expression. Batch A patients consists of six IFG patients (labeled as 1 IFG to 6 IFG) and eight T2D patients (labeled as 1 T2D to 8 T2D). CTL, healthy controls; IFG, impaired fasting glucose; T2D, type 2 diabetes.
Figure 5
Figure 5. Identification of ‘signature miRNAs’ expressed in IFG and T2D (Batch A).
A. Heatmap of the potential ‘signature miRNAs’ expressed in IFG and T2D. B. Quantitative stem-loop RT-PCR of eight selected miRNAs in IFG (checkered bars) and T2D (black bars) against CTL (white bars) and C. Real-time PCR of respective predicted mRNA targets in IFG (checkered bars) and T2D (black bars) against CTL (white bars). Data presented as mean ± SEM of both individual and pooled samples of each category. Fold change below one are expressed as negative values. Validation is done in triplicates. Statistically significant differences are tested at p<0.05 significance. *p<0.05, **p<0.01, ***p<0.001. Batch A patients consists of six IFG patients (labeled as 1 IFG to 6 IFG) and eight T2D patients (labeled as 1 T2D to 8 T2D). CTL, healthy controls; IFG, impaired fasting glucose; T2D, type 2 diabetes. Green: down-regulation; Red: up-regulation; Grey: not detected. Predictions: miR-144/IRS1; miR-146a/PTPN1; miR-150/GLUT4 and CBL; miR-182/FOXO1; miR-192/INSR; miR-30d/INS; miR-29a and miR-320/AKT2.
Figure 6
Figure 6. Comparison of miRNA expressions with its corresponding predicted mRNA targets (Batch B).
A . A heatmap of quantitative stem-loop RT-PCR of eight selected miRNAs and B . A heatmap of real-time PCR of respective predicted mRNA targets. Validation has been done in another independent batch (Batch B) of participants in triplicates. Statistically significant differences are tested at p<0.05 significance. Batch B patients consists of eight IFG patients (labeled as 7 IFG to 14 IFG) and thirteen T2D patients (labeled as 9 T2D to 21 T2D).CTL, healthy controls; IFG, impaired fasting glucose; T2D, type 2 diabetes. Green: down-regulation; Red: up-regulation; Grey: not detected. Predictions: miR-144/IRS1; miR-146a/PTPN1; miR-150/GLUT4 and CBL; miR-182/FOXO1; miR-192/INSR; miR-30d/INS; miR-29a and miR-320/AKT2.
Figure 7
Figure 7. Comparison of miRNA expressions with its corresponding predicted mRNA targets (in rat's blood, tissues and exosomes).
A . A heatmap of quantitative stem-loop RT-PCR and real-time PCR of selected miRNAs and mRNAs respectively. Samples are obtained from a combination of low dose STZ and high-fat diet induced T2D rat model. B . A heatmap of quantitative stem-loop RT-PCR and real-time PCR of selected miRNAs and mRNAs respectively. Samples are obtained from high-fat diet induced T2D rat model. Validation has been done in triplicates. Statistically significant differences are tested at p<0.05 significance. Green: down-regulation; Red: up-regulation; Grey: not detected. Predictions: miR-144/IRS1; miR-146a/PTPN1; miR-150/GLUT4 and CBL; miR-182/FOXO1; miR-192/INSR; miR-30d/INS; miR-29a and miR-320/AKT2.
Figure 8
Figure 8. A. Quantitative stem-loop RT-PCR of selected miRNAs in islets with basal glucose concentration of 5 mM (white bars) and high glucose concentration of 25 mM (black bars) and B. Real-time PCR of respective predicted mRNA targets in with basal glucose concentration of 5 mM (white bars) and high glucose concentration of 25 mM (black bars).
Data presented as mean ± SEM with n = 3 for each group. Statistically significant differences are tested at p<0.05 significance. *p<0.05, **p<0.01, ***p<0.001. Predictions: miR-144/IRS1; miR-146a/PTPN1; miR-150/GLUT4 and CBL; miR-182/FOXO1; miR-192/INSR; miR-30d/INS; miR-29a and miR-320/AKT2.
Figure 9
Figure 9. Western Blot analysis of IRS1, Tyr612-phospho-IRS1 and Ser636+639-phospho-IRS1 in CTL (white bars), IFG (checkered bars) and T2D (black bars) individuals.
The data presented here is a representative of three independent experiments (both individual and pooled serum samples showed similar profiles) and as mean ± SEM. Fold change below one are expressed as negative values. Statistically significant differences are tested at p<0.05 significance. *p<0.05, **p<0.01, ***p<0.001. CTL, healthy controls; IFG, impaired fasting glucose; T2D, type 2 diabetes.
Figure 10
Figure 10. Direct inhibitory effect of miR-144 on IRS1.
Dual luciferase assay. Quantitation of the effects of pre- or anti- miR-144 interaction with the 3′ UTR of IRS1. Binding sites of miR-144 at 3′UTR of IRS1 and mutated constructs of the binding sites are listed in Table S12. The plasmid constructs together with pre- or anti- miR-144 were co-transfected into HeLa cells. Luminescence for luciferase gene activity in treated samples (pre or anti miR-144) were obtained 48 hours post-transfection. Relative luminescence was obtained by normalizing the values against control plasmids, pMIR-REPORT™ without any 3′UTR insert. Data presented as mean ± SEM with n = 3. Fold change below one are expressed as the negative values. Statistically significant differences are tested at p<0.05 significance. *p<0.05, **p<0.01, ***p<0.001.
Figure 11
Figure 11. Expression of IRS1 in HeLa/3T3L1 cells transfected with pre- or anti- miR-144.
A. Endogenous levels of miR-144 and IRS1 in HeLa/3T3L1 cells as delta threshold cycle (ΔCt) value with respect to 18S rRNA. Previous reports – have also confirmed that miR-144 and IRS1 are expressed in HeLa cells. B. Relative miR-144 expression in HeLa/3T3L1 cells transfected with either pre- or anti- miR-144 at a concentration of 30 nM. C. Relative IRS1 mRNA expression in HeLa/3T3L1 cells transfected with either pre- or anti- miR-144at a concentration of 30 nM. Data presented as mean ± SEM (n = 3). Fold change below one are expressed as the negative values. Statistically significant differences are tested at p<0.05 significance. *p<0.05, **p<0.01, ***p<0.001. D. IRS1 immunoreactives in HeLa cells transfected with either pre- or anti- miR-144. The cells were fixed and immunolabeled with IRS1 antibody (green) and nuclear stain DAPI (blue). Left panel: Non-transfected cells; Middle panel: Pre miR-144 transfected cells showed reduced fluorescence intensity; Right panel: Anti miR-144 transfected cells showed increased fluorescence intensity. The data presented here is a representative of three independent experiments.
Figure 12
Figure 12. Possible mode of mechanism on miRNA-regulatory networks.
Possible ways in which miRNA govern different stages of the insulin pathway in the pathogenesis of Type 2 Diabetes. miRNAs that have been reported in previous studies are indicated in brackets while those underlined are predicted by the five best target prediction databases namely RegRNA, MirBase, TargetScan, Mirgen and microRNA.org.

Similar articles

Cited by

References

    1. Lee RC, Feinbaum RL, Ambros V. The C. elegans heterochronic gene lin-4 encodes small RNAs with antisense complementarity to lin-14. Cell. 1993;75:843–854. - PubMed
    1. Pillai RS, Bhattacharyya SN, Filipowicz W. Repression of protein synthesis by miRNAs: how many mechanisms? Trends Cell Biol. 2007;17:118–126. - PubMed
    1. Li LC, Okino ST, Zhao H, Pookot D, Place RF, et al. Small dsRNAs induce transcriptional activation in human cells. Proc Natl Acad Sci U S A. 2006;103:17337–17342. - PMC - PubMed
    1. Janowski BA, Younger ST, Hardy DB, Ram R, Huffman KE, et al. Activating gene expression in mammalian cells with promoter-targeted duplex RNAs. Nat Chem Biol. 2007;3:166–173. - PubMed
    1. Vasudevan S, Tong Y, Steitz JA. Switching from repression to activation: microRNAs can up-regulate translation. Science. 2007;318:1931–1934. - PubMed

Publication types

Associated data