. 2011;6(8):e22959.
doi: 10.1371/journal.pone.0022959. Epub 2011 Aug 2.

Overexpression of HTRA1 leads to ultrastructural changes in the elastic layer of Bruch's membrane via cleavage of extracellular matrix components

Affiliations

Overexpression of HTRA1 leads to ultrastructural changes in the elastic layer of Bruch's membrane via cleavage of extracellular matrix components

Sarah Vierkotten et al. PLoS One. 2011.

Abstract

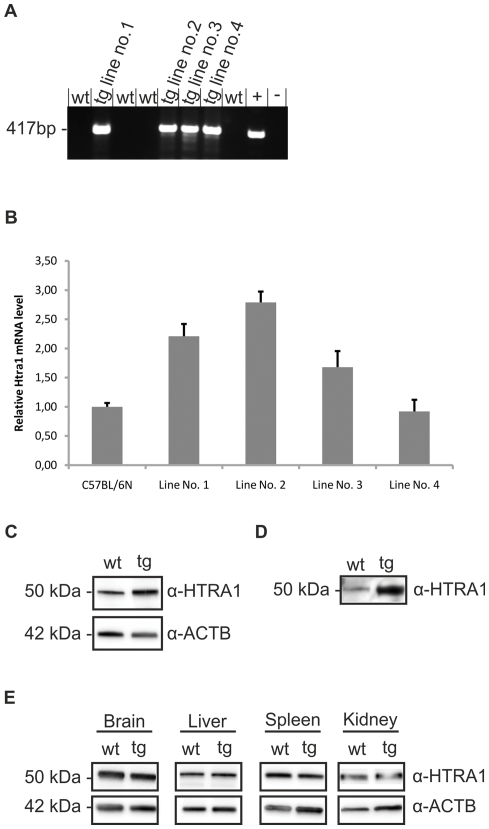
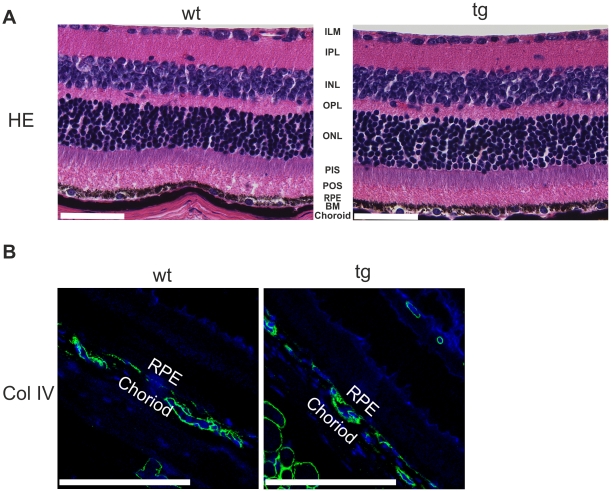
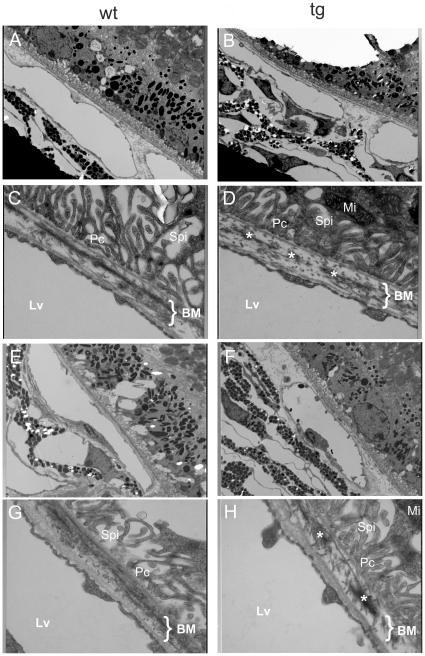
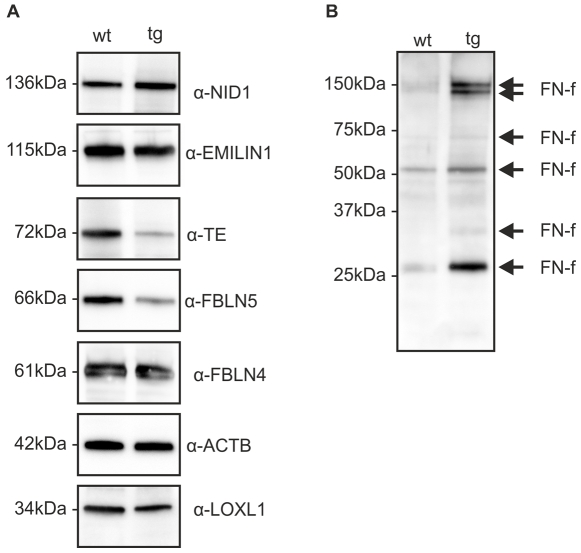
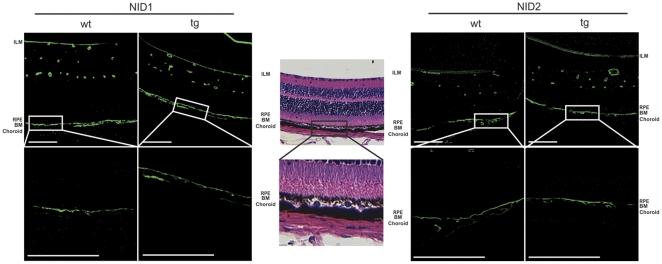
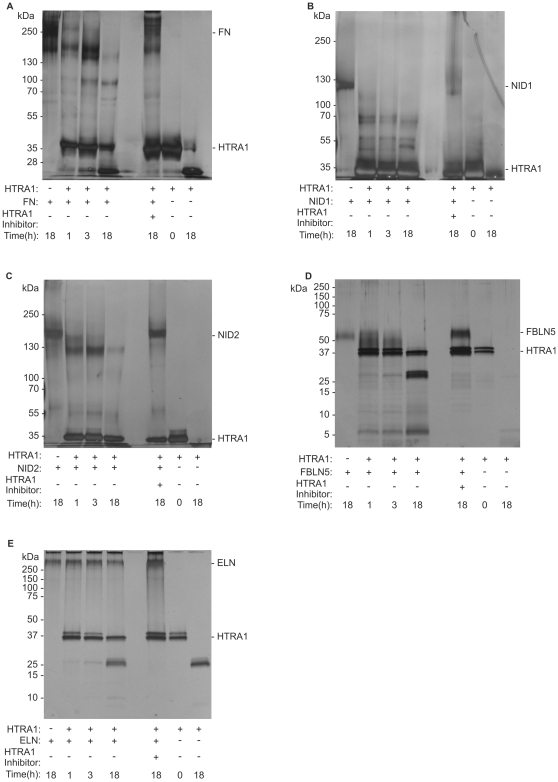
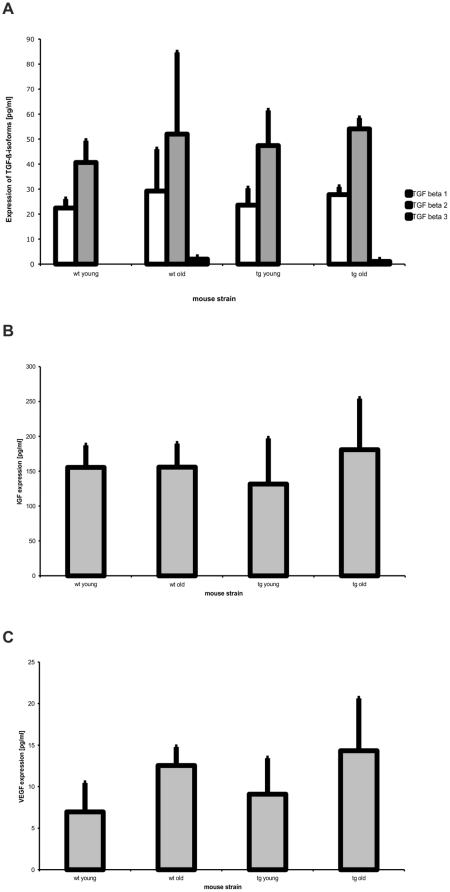
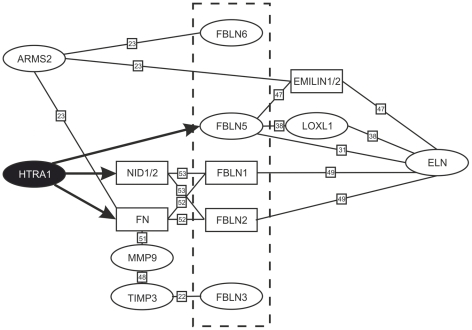
Variants in the chromosomal region 10q26 are strongly associated with an increased risk for age-related macular degeneration (AMD). Two potential AMD genes are located in this region: ARMS2 and HTRA1 (high-temperature requirement A1). Previous studies have suggested that polymorphisms in the promotor region of HTRA1 result in overexpression of HTRA1 protein. This study investigated the role of HTRA1 overexpression in the pathogenesis of AMD. Transgenic Htra1 mice overexpressing the murine protein in the retinal pigment epithelium (RPE) layer of the retina were generated and characterized by transmission electron microscopy, immunofluorescence staining and Western Blot analysis. The elastic layer of Bruch's membrane (BM) in the Htra1 transgenic mice was fragmented and less continuous than in wild type (WT) controls. Recombinant HTRA1 lacking the N-terminal domain cleaved various extracellular matrix (ECM) proteins. Subsequent Western Blot analysis revealed an overexpression of fibronectin fragments and a reduction of fibulin 5 and tropoelastin in the RPE/choroid layer in transgenic mice compared to WT. Fibulin 5 is essential for elastogenesis by promoting elastic fiber assembly and maturation. Taken together, our data implicate that HTRA1 overexpression leads to an altered elastogenesis in BM through fibulin 5 cleavage. It highlights the importance of ECM related proteins in the development of AMD and links HTRA1 to other AMD risk genes such as fibulin 5, fibulin 6, ARMS2 and TIMP3.


Conflict of interest statement

Competing Interests: This study was partly funded by Novartis (no employment, no consultancy, no patents, no products in development, no marketed products, etc.). There were no other commercial funders. This does not alter the authors' adherence to all the PLoS ONE policies on sharing data and materials.

Figures

Figure 1
Figure 1. Genotyping and protein analysis of Htra1 transgenic mice.
(A) PCR of genomic DNA from transgenic and WT mice. Transgenic mice show amplification with a visible band at 417 bp (tg) as can be seen in the positive control (+). WT mice (wt) as well as the negative control (−) show no amplification. (B) Quantitative real-time PCR determination of Htra1 mRNA levels from total RNA isolated from posterior eyes of C57BL/6N and transgenic lines no. 1 to 4 mice. An increase of Htra1 mRNA in Htra1 transgenic lines compared to WT was observed. Transgenic line no 2 shows the highest rate with a 2.79 fold increase (3mice/C57BL/6N and 12mice/transgenic line: 3 independent experiments, 3mice/group). Data are expressed as means ±SD. Relative mRNA levels were normalized to Actb and expressed as fold change relative to control. (C) Western Blot analysis of RPE/Choroid lysates from 3 month old WT (wt) and transgenic (tg) mice. Transgenic mice show a higher expression of HTRA1 protein compared to WT (1mice/group, 6 independent experiments). Expression of ACTB serves as a loading control. Image is representative. (D) Western Blot analysis of primary RPE cells supernatant. Cells were cultured till confluent and medium was removed 24 hours after exchange of fetal bovine serum-free medium. The experiment clearly demonstrates secretion of HTRA1 from RPE cells (1mice/group, 6 independent experiments). Note that the expression level of HTRA1 is higher in transgenic cell culture supernatants. Image is representative. (E) Western Blot analysis of tissue extracts from 3 month old WT (wt) and transgenic mice (tg). There are no differences in HTRA1 expression found in brain, liver, spleen and kidney of transgenic mice compared of WT (1mice/group, 6 independent experiments). Expression of ACTB serves as a loading control. Image is representative.
Figure 2
Figure 2. Paraffin cross sections of 3 month old WT and Htra1 transgenic mice.
(A) HE staining shown in original 40× magnification (Scale Bar: 100 µm). Mice show normal choroidal and retinal architecture (1mice/group, 3 independent experiments). Image is representative. ILM, inner limiting membrane; IPL, inner plexiform layer; INL, inner nuclear layer; OPL, outer plexiform layer; ONL, outer nuclear layer; PIS, photoreceptor inner segments; POS, photoreceptor outer segments; RPE, retinal pigment epithelium; BM, Bruch's membrane. (B) Immunofluorescence for collagen IV (Col IV) shown in original 100× magnification (Scale Bar: 100 µm). Transgenic mice show normally developed choroidal vasculature (1mice/group, 3 independent experiments). Image is representative. Green: Collagen IV, Blue: DAPI; RPE, retinal pigment epithelium.
Figure 3
Figure 3. Transmission electron micrographs of BM.
TEM images showing the elastic lamina of BM in WT (A, C, E, G) and Htra1 transgenic (B, D, F, H) mice (A–D at the age of 3 month; E–H at the age of 12 month). A, B and E, F at original 3000× magnification and C, D and G, H at original 20000× magnification. Note the fragmentation of the elastic lamina in Htra1 transgenic mice seen as discontinuities in contrast to the continuous elastic lamina of the WT mice. These discontinuities were observed in all transgenic mice that were analyzed (1mice/group, 6 independent experiments). Image is representative. BM, Bruch's membrane; Lv, Lumen vasculare (Lumen of a vessel); Mi, Mitochondria; Pc, Processus cellularis (cell process); Spi, Spatium intermembranosum (intermembranous cleft).
Figure 4
Figure 4. Western Blot analysis of RPE/choroid Lysates from WT (wt) and transgenic (tg) mice.
(A) Transgenic mice show a lower expression of fibulin 5 (FBLN5) and tropoelastin (TE) compared to WT. Other ECM components like nidogen 1 (NID-1), EMILIN1, fibulin 4 (FBLN4) and LOXL1 are equally expressed (1mice/group, 6 independent experiments). Expression of ACTB serves as a loading control. Image is representative. (B) Transgenic mice demonstrate degradation of fibronectin with the generation of fibronectin fragments (FN-f) (1mice/group, 6 independent experiments). Image is representative.
Figure 5
Figure 5. Immunostaining of ECM proteins in BM.
(A) Immunofluorescence for nidogen 1 (NID1) and nidogen 2 (NID2) shown in original 40× and 100× magnification (Scale Bar: 100 µm). There is no difference in staining intensity observed between WT and transgenic mice (1mice/group, 3 independent experiments). Image is representative. Green∶nidogen 1 and nidogen 2, respectively. BM: Bruch's membrane; ILM: inner limiting membrane; RPE: retinal pigment epithelium. Image of H&E stained sections in 40× and 100× magnification provides orientation.
Figure 6
Figure 6. Degradation of ECM components by recombinant HTRA1.
Purified ECM proteins and purified recombinant HTRA1 were incubated at 37°C in 50 mM Tris-HCl pH7,6, 5 mM CaCl2, 150 mM NaCl over a period of 18 hours (h). (A) Degradation of fibronectin. Fibronectin (FN) shows no sign of degradation when incubated alone. Recombinant HTRA1 degrades fibronection after three hours of incubation. The inhibitor of HTRA1 completely abolishes degradation of fibronectin by HTRA1. (B) Degradation of nidogen 1. Nidogen 1 (NID1) shows no sign of degradation when incubated alone. Recombinant HTRA1 cleaves nidogen-1 after one hours of incubation. The inhibitor of HTRA1 completely abolishes degradation of nidogen 1 by HtrA1. (C) Degradation of nidogen 2. Nidogen 2 (NID2) shows no sign of degradation when incubated alone. Recombinant HTRA1 cleaves nidogen 2 after one hours of incubation. The inhibitor of HTRA1 completely abolishes degradation of nidogen 2 by HTRA1. (D) Degradation of fibulin 5 by HTRA1. Fibulin 5 (FBLN5) is degraded by HTRA1 already after one hour, but shows no sign of degradation when incubated alone. The inhibitor of HTRA1 completely abolishes degradation of fibulin 5 by HTRA1. (E) Degradation of elastin. Elastin (ELN) shows no sign of degradation when incubated alone and when incubated with recombinant HTRA1.
Figure 7
Figure 7. Luminex Assay of growth factors in RPE/choroid lysates.
Concentration of growth factors in RPE/Choroid lysates of transgenic (tg) and WT (wt) mice at 3 month (young) and 12 month (old) of age (4mice/group, 3independent experiments). Data are presented as means; bars, ± SD. (A) Concentration of TGF-ß isoforms in RPE/choroid lysates. WT and transgenic mice show no significant differences in TGF-ß isoform concentration at young or old age. (B) Concentration of IGF-1 in RPE/choroid lysates. WT and transgenic mice show no significant differences in IGF-1 concentration at young or old age. (C) Concentration of VEGF in RPE/choroid lysates. WT and transgenic mice show no significant differences in VEGF concentration at young or old age.
Figure 8
Figure 8. HTRA1 interacts with ECM proteins.
Black arrows indicate cleavage by HTRA1. Proteins encoded by genes known to be related to macular degenerations are circled. Fibulins are delineated by the dashed box. Note that three of five fibulin genes shown have been implicated in maculopathies, and one of five directly interacts with HTRA1. Reference(s) for interactions described earlier are indicated in small boxes. , , , , – ARMS2, age-related macular susceptibility 2; ELN, elastin; EMILIN, elastin microfibril interface-located protein; FBLN, fibulin; FN, fibronectin; HTRA1, high-temperature requirement A1; LOXL1, lysyl oxidase-like 1; MMP9, matrix metalloproteinase-9; NID, Nidogen; TIMP3, tissue inhibitor of metalloproteinase 3.
Figure 9
Figure 9. Scheme of the transgenic construct Rpe65/Htra1 (3123 bp).

Similar articles

Cited by

References

    1. Thornton J, Edwards R, Mitchell P, Harrison RA, Buchan I, et al. Smoking and age-related macular degeneration: a review of association. Eye (Lond) 2005;19:935–944. - PubMed
    1. Clemons TE, Milton RC, Klein R, Seddon JM, Ferris FL., 3rd Risk factors for the incidence of Advanced Age-Related Macular Degeneration in the Age-Related Eye Disease Study (AREDS) AREDS report no. 19. Ophthalmology. 2005;112:533–539. - PMC - PubMed
    1. Jakobsdottir J, Conley YP, Weeks DE, Mah TS, Ferrell RE, et al. Susceptibility genes for age-related maculopathy on chromosome 10q26. Am J Hum Genet. 2005;77:389–407. - PMC - PubMed
    1. Fisher SA, Abecasis GR, Yashar BM, Zareparsi S, Swaroop A, et al. Meta-analysis of genome scans of age-related macular degeneration. Hum Mol Genet. 2005;14:2257–2264. - PubMed
    1. Rivera A, Fisher SA, Fritsche LG, Keilhauer CN, Lichtner P, et al. Hypothetical LOC387715 is a second major susceptibility gene for age-related macular degeneration, contributing independently of complement factor H to disease risk. Hum Mol Genet. 2005;14:3227–3236. - PubMed

Publication types

MeSH terms

Substances

LinkOut - more resources