

Adaptive strategy for the statistical analysis of connectomes
- PMID: 21829681
- PMCID: PMC3150413
- DOI: 10.1371/journal.pone.0023009
Adaptive strategy for the statistical analysis of connectomes
Abstract
We study an adaptive statistical approach to analyze brain networks represented by brain connection matrices of interregional connectivity (connectomes). Our approach is at a middle level between a global analysis and single connections analysis by considering subnetworks of the global brain network. These subnetworks represent either the inter-connectivity between two brain anatomical regions or by the intra-connectivity within the same brain anatomical region. An appropriate summary statistic, that characterizes a meaningful feature of the subnetwork, is evaluated. Based on this summary statistic, a statistical test is performed to derive the corresponding p-value. The reformulation of the problem in this way reduces the number of statistical tests in an orderly fashion based on our understanding of the problem. Considering the global testing problem, the p-values are corrected to control the rate of false discoveries. Finally, the procedure is followed by a local investigation within the significant subnetworks. We contrast this strategy with the one based on the individual measures in terms of power. We show that this strategy has a great potential, in particular in cases where the subnetworks are well defined and the summary statistics are properly chosen. As an application example, we compare structural brain connection matrices of two groups of subjects with a 22q11.2 deletion syndrome, distinguished by their IQ scores.
Conflict of interest statement
Figures
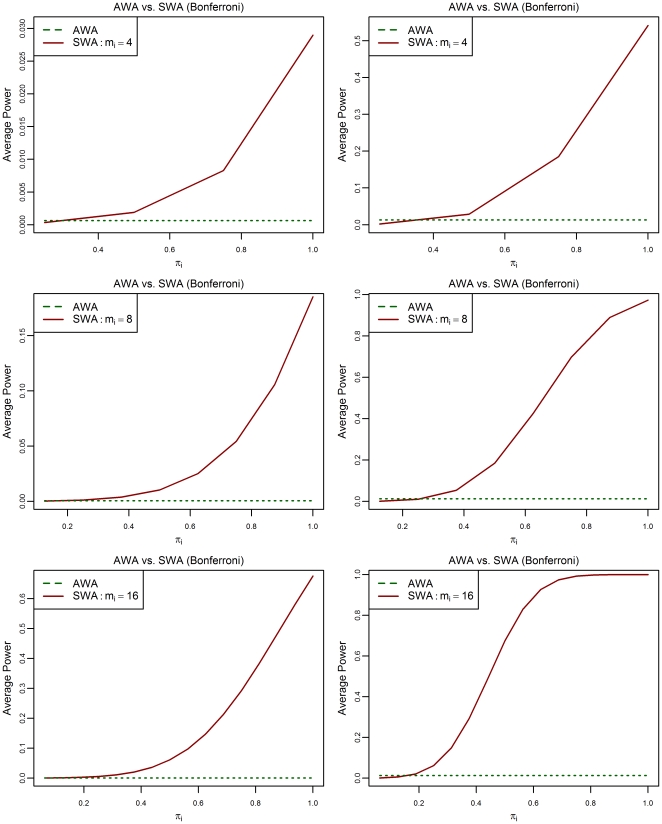
 (4, 8 or 16) and two different values of the raw effect Δ (1 or 2). The other parameters are:
  .
.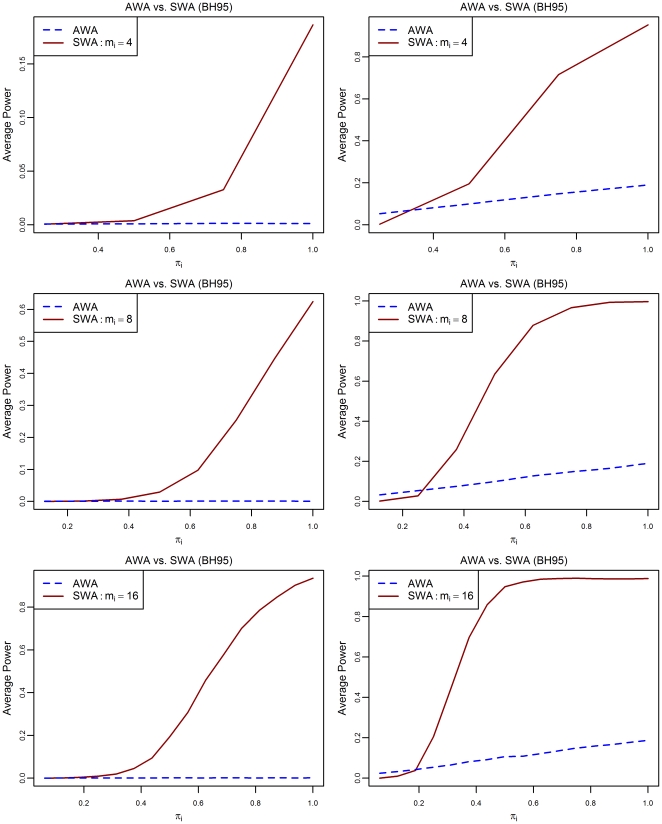
 (4, 8 or 16) and two different values of the raw effect Δ (1 or 2) are used. The other parameters are:
  .
.
References
-
- Hagmann P. From diffusion MRI to brain connectomics. 2005. PhD Thesis (Ecole Polytechnique Fédérale de Lausanne, Lausanne, Switzerland)
-
- Biswal B, Yetkin FZ, Haughton VM, Hyde JS. Functional connectivity in the motor cortex of resting human brain using echo-planar MRI. Magn Reson Med. 1995;34:537–541. - PubMed
Publication types
MeSH terms
LinkOut - more resources
Full Text Sources
Research Materials
