Comparative Study
. 2012 Apr 1;520(5):914-32.
doi: 10.1002/cne.22738.

Retinal input influences the size and corticocortical connectivity of visual cortex during postnatal development in the ferret

Affiliations
Comparative Study

Retinal input influences the size and corticocortical connectivity of visual cortex during postnatal development in the ferret

A S Bock et al. J Comp Neurol. .

Abstract

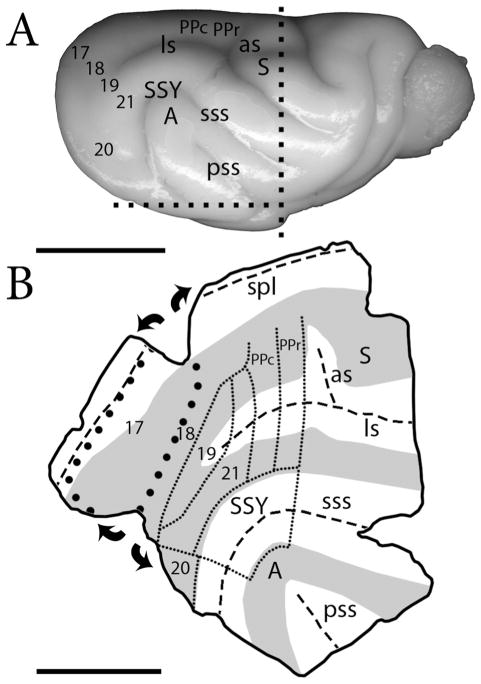
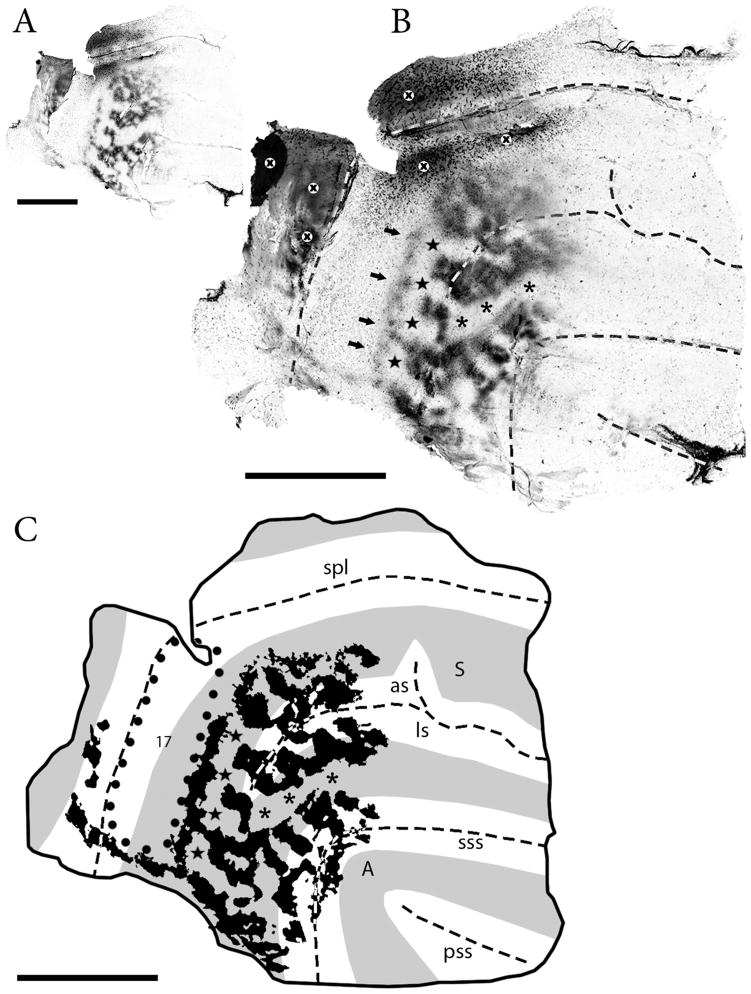
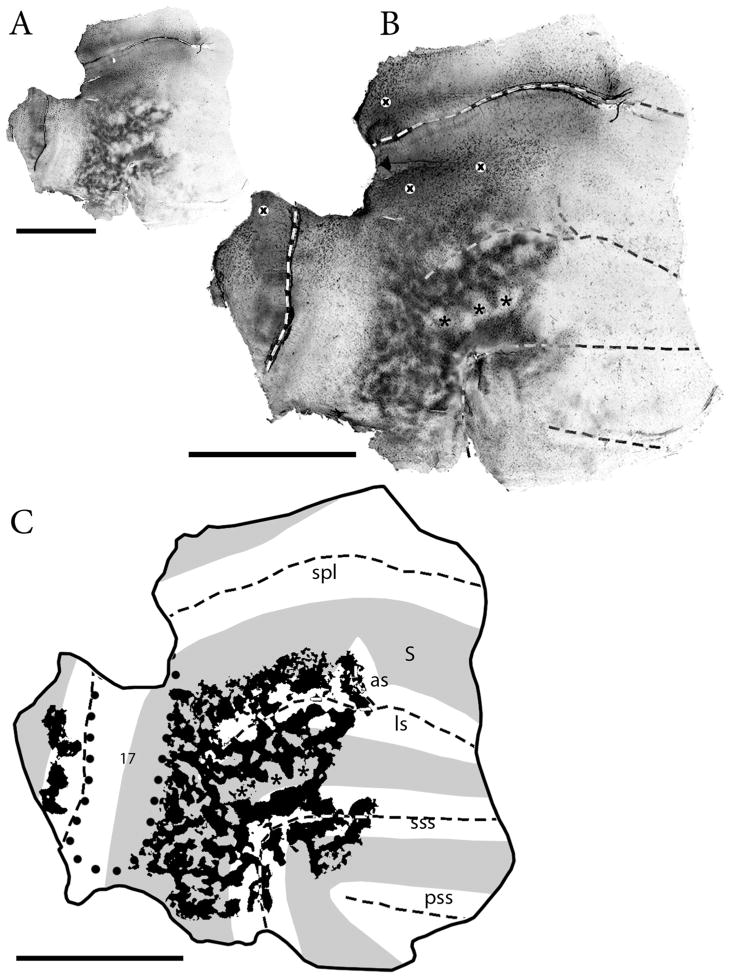
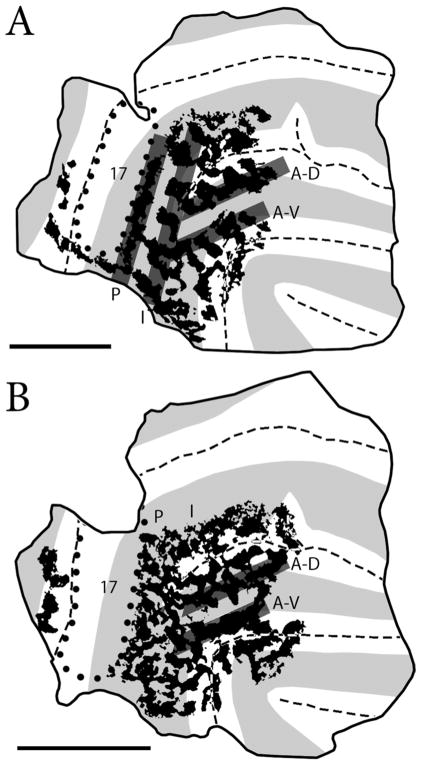
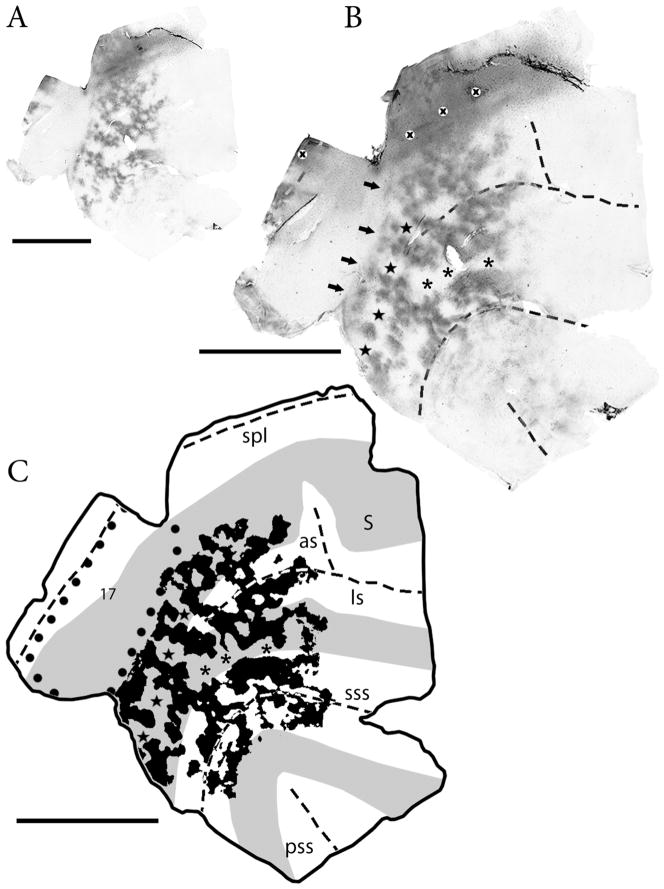
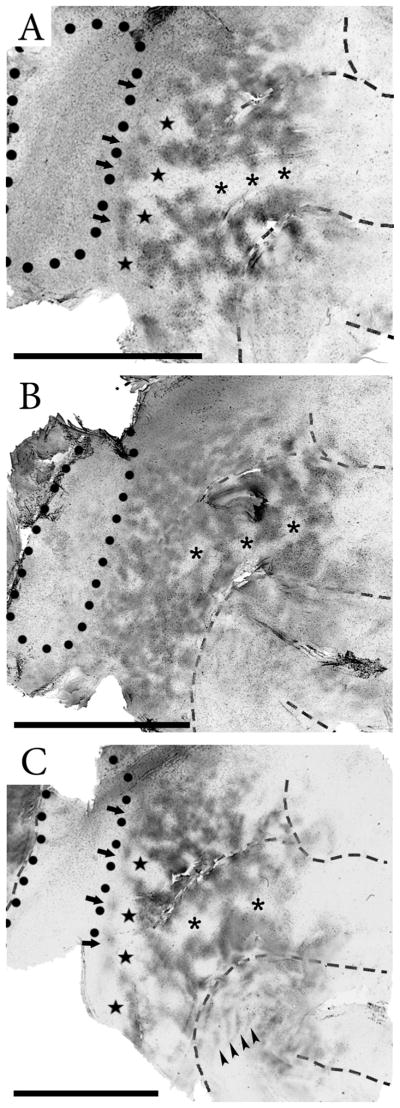
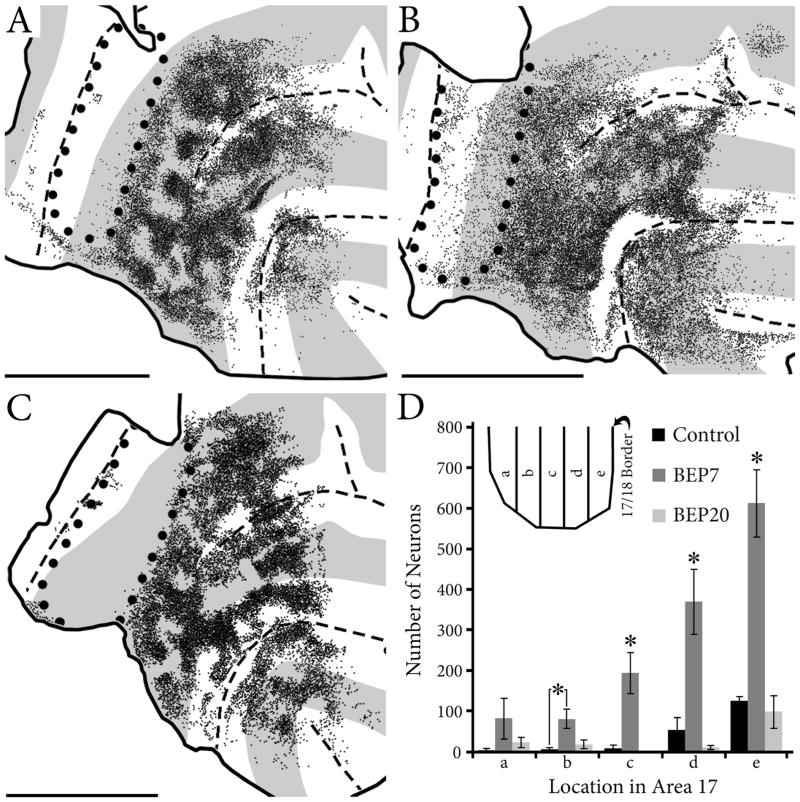
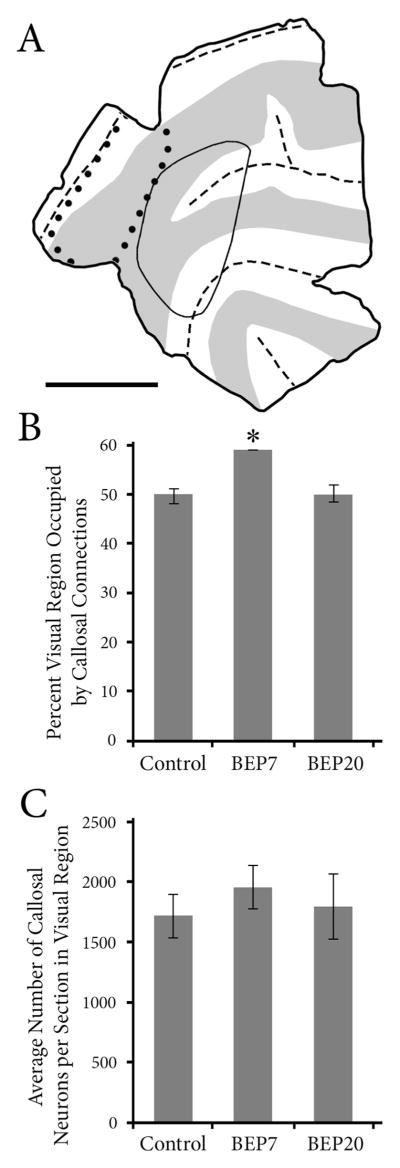
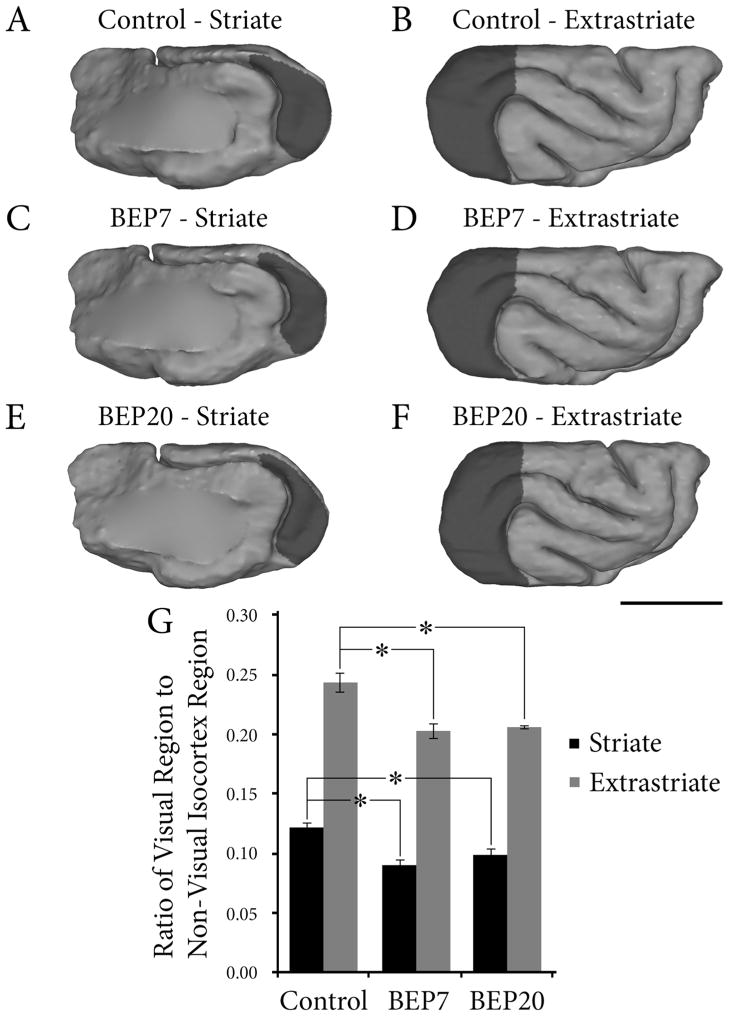
Retinal input plays an important role in the specification of topographically organized circuits and neuronal response properties, but the mechanism and timing of this effect is not known in most species. A system that shows dramatic dependence on retinal influences is the interhemispheric connection through the corpus callosum. Using ferrets, we analyzed the extent to which development of the visual callosal pattern depends on retinal influences, and explored the period during which these influences are required for normal pattern formation. We studied the mature callosal patterns in normal ferrets and in ferrets bilaterally enucleated (BE) at postnatal day 7 (P7) or P20. Callosal patterns were revealed in tangential sections from unfolded and flattened brains following multiple injections of horseradish peroxidase in the opposite hemisphere. We also estimated the effect of enucleation on the surface areas of striate and extrastriate visual cortex by using magnetic resonance imaging (MRI) data from intact brains. In BEP7 ferrets we found that the pattern of callosal connections was highly anomalous and the sizes of both striate and extrastriate visual cortex were significantly reduced. In contrast, enucleation at P20 had no significant effect on the callosal pattern, but it still caused a reduction in the size of striate and extrastriate visual cortex. Finally, retinal deafferentation had no significant effect on the number of visual callosal neurons. These results indicate that the critical period during which the eyes influence the development of callosal patterns, but not the size of visual cortex, ends by P20 in the ferret.


Figures

Figure 1
Figure 1
A: Intact ferret brain showing the location of gyri, sulci, and various cortical areas. Dashed lines indicate cuts made to separate the posterior block that was unfolded and flattened. Posterior is left, and dorsal is up. B: Diagram showing an unfolded and flattened cortex. Curved arrows indicate further cuts made to fully flatten the cortex, dashed lines indicate fundi of sulci, gray areas indicate the surface of gyri, large dotted line indicates the outline of V1, and small dotted lines indicate the borders of other visual areas. A, auditory cortex; as, ansate sulcus; ls, lateral sulcus; PPc, posterior parietal caudal; PPr, posterior parietal rostral; pss, pseudosylvian sulcus; S, somatosensory cortex; spl, splenial sulcus; sss, suprasylvian sulcus; SSY, suprasylvian visual area. Scale bar = 1 cm in A, B.
Figure 2
Figure 2
Visual callosal pattern in normal ferret. A: Single HRP-stained tangential section from a control ferret (case D). Dark areas correspond to callosal cell bodies and axonal terminations labeled with HRP reaction product. B: Data superimposed from five aligned HRP-stained tangential sections from the control ferret shown in A. C: Thresholded version of the callosal pattern shown in B. Black areas correspond to callosal regions densely labeled with HRP reaction product. Dashed lines indicate fundi of sulci, gray areas indicate the surface of gyri, and the dotted line indicates the outline of V1. Black stars on the lateral gyrus and asterisks on the suprasylvian gyrus indicate acallosal regions common to all control ferrets; black arrows indicate string of callosal patches located in area 18. Black X’s in white circles in B indicate regions of artifactual labeling. Anatomical abbreviations as in Figure 1. Scale bar = 1 cm in A–C.
Figure 3
Figure 3
A: Single HRP-stained tangential section from a BEP7 ferret (case D5). Dark areas correspond to callosal cell bodies and axonal terminations labeled with HRP reaction product. B: Data superimposed from four aligned HRP-stained tangential sections from the BEP7 ferret shown in A. C: Thresholded version of the callosal pattern shown in B; black areas correspond to callosal regions densely labeled with HRP reaction product. Dashed lines indicate fundi of sulci, gray areas indicate the surface of gyri, and the dotted line indicates the outline of V1. Black asterisks (suprasylvian gyrus) indicate acallosal regions common to all BEP7 ferrets. Black X’s in white circles in B indicate regions of artifactual labeling. Anatomical abbreviations as in Figure 1. Scale bar = 1 cm in A–C.
Figure 4
Figure 4
A: Diagram showing the four callosal band-like regions (dark gray bars) in a control ferret (case D). B: Diagram of the callosal pattern in a BEP7 ferret (case D5) showing two callosal band-like regions identified in BEP7 ferrets. Dashed lines indicate fundi of sulci, light gray areas indicate the surface of gyri, and the dotted line indicates the outline of V1. P, posterior band; I, intermediate band; A-V, anteroventral band; A-D, anterodorsal band. Scale bar = 1 cm in A, B.
Figure 5
Figure 5
A: Single HRP-stained tangential section from a BEP20 ferret (case E3). Dark areas correspond to callosal cell bodies and axonal terminations labeled with HRP reaction product. B: Data superimposed from four aligned HRP-stained tangential sections from the BEP20 ferret shown in A. C: Thresholded version of the callosal pattern shown in B; black areas correspond to callosal regions densely labeled with HRP reaction product. Dashed lines indicate fundi of sulci, gray areas indicate the surface of gyri, and the dotted line indicates the outline of V1. Black stars on the lateral gyrus and asterisks on the suprasylvian gyrus indicate acallosal regions common to all BEP20 ferrets; black arrows indicate string of callosal patches located in area 18. Black X’s in white circles in B indicate regions of artifactual labeling. Anatomical abbreviations as in Figure 1. Scale bar = 1 cm in A–C.
Figure 6
Figure 6
Data superimposed from several aligned HRP-stained tangential sections from another control ferret (A, case D4), another BEP7 ferret (B, case D1), and another BEP20 ferret (C, case E4). Dark areas correspond to callosal cell bodies and axonal terminations labeled with HRP reaction product. Dashed lines indicate fundi of sulci; the dotted line indicates the outline of V1; black stars on the lateral gyrus and asterisks on the suprasylvian gyrus indicate acallosal regions common to ferrets of that group; black arrows indicate string of callosal patches in area 18. In C, arrowheads on the ectosylvian gyrus indicate several small, mediolaterally oriented callosal bands that likely correspond to features of the callosal pattern described previously in auditory cortex of the ferret (Wallace and Harper, 1997). Anatomical abbreviations as in Figure 1. Scale bar = 1 cm in A–C.
Figure 7
Figure 7
Distribution of individual HRP-labeled callosal cells (black dots) reconstructed from the same tangential sections used to reconstruct the overall staining patterns. A: Normal ferret shown in Figure 2. B: BEP7 ferret shown in Figure 3. C: BEP20 ferret shown in Figure 5. Dashed lines indicate fundi of sulci, gray areas indicate the surface of gyri, and the dotted line indicates the outline of V1. D: Histogram quantifying the distribution of callosal cells in area 17 of control, BEP7, and BEP20 ferrets. Asterisks indicate a significant increase in the number of callosal cells in BEP7 ferrets compared with control and BEP20 animals for bins “c,” “d,” and “e,” and a significant increase in the number of callosal cells in BEP7 ferrets compared with controls for bin “b.” Error bars indicate standard error of the mean (SEM). Scale bar = 1 cm in A–C.
Figure 8
Figure 8
A: Diagram showing the common extrastriate visual region (thin black line) used for quantitative analysis in all ferrets (see Materials and Methods). Dashed lines indicate fundi of sulci, gray areas indicate the surface of gyri, and the dotted line indicates the outline of V1. B: Histogram displaying the percentage of the common extrastriate visual region occupied by callosal labeling in control, BEP7, and BEP20 ferrets. Asterisk indicates that the percentage of the visual region occupied by callosal labeling in BE7 ferrets is significantly (P <0.05) greater than in control and BEP20 ferrets. C: Histogram displaying the average number of labeled callosal neurons per section in the common visual region outlined in A. There were no significant differences among control, BEP7, and BEP20 ferrets. Error bars in B and C indicate SEM. Scale bar = 1 cm in A.
Figure 9
Figure 9
Measurements of area size of visual cortex using surface reconstructions from MRI data. Medial views (left panels) show striate regions (dark gray) in (A) control ferret (case D4); (C) BEP7 ferret (case D1); and (E) BEP20 ferret (case E4). Lateral views (right panels) show extrastriate regions (dark gray) in (B) control ferret (case D4); (D) BEP7 ferret (case D1); and (F) BEP20 ferret (case E4). G: Histogram displaying the ratio of the striate (black bars) and extrastriate regions (gray bars) to the nonvisual isocortex regions in control, BEP7, and BEP20 ferrets. Asterisks indicate that the normalized sizes of striate and extrastriate regions in control ferrets were significantly (P < 0.05) larger than the sizes of the corresponding regions in BEP7 and BEP20 ferrets. Error bars indicate SEM. Scale bar = 1 cm in F (applies to A–F).

Similar articles

Cited by

References

    1. Abel PL, O’Brien BJ, Olavarria JF. Organization of callosal linkages in visual area V2 of macaque monkey. J Comp Neurol. 2000;428:278–293. - PubMed
    1. Aggoun-Aouaoui D, Kiper DC, Innocenti GM. Growth of callosal terminal arbors in primary visual areas of the cat. Eur J Neurosci. 1996;8:1132–1148. - PubMed
    1. Bock AS, Kroenke CD, Taber EN, Olavarria JF. Critical period for the effects of neonatal enucleation on callosal connectivity and water diffusion anisotropy in the ferret visual system. Program No. 580.16; Society for Neuroscience Annual Meeting; 2010; San Diego, CA. 2010a.
    1. Bock AS, Olavarria JF, Leigland LA, Taber EN, Jespersen SN, Kroenke CD. Diffusion tensor imaging detects early cerebral cortex abnormalities in neuronal architecture induced by bilateral neonatal enucleation: an experimental model in the ferret. Front Syst Neurosci. 2010b;4:149. - PMC - PubMed
    1. Bourdet C, Olavarria JF, Van Sluyters RC. Distribution of visual callosal neurons in normal and strabismic cats. J Comp Neurol. 1996;366:259–269. - PubMed

Publication types

MeSH terms