

Unbiased comparison of sample size estimates from longitudinal structural measures in ADNI
- PMID: 21830259
- PMCID: PMC3782292
- DOI: 10.1002/hbm.21386
Unbiased comparison of sample size estimates from longitudinal structural measures in ADNI
Abstract
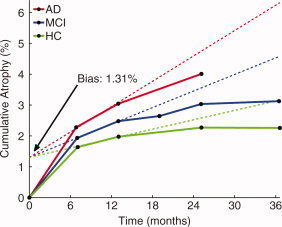
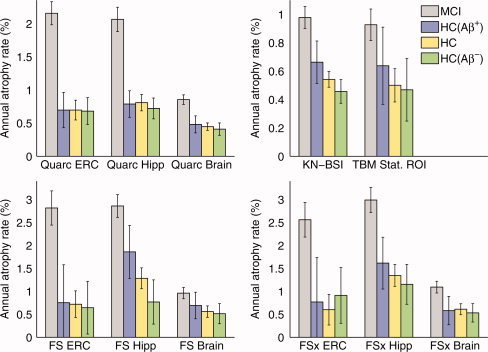
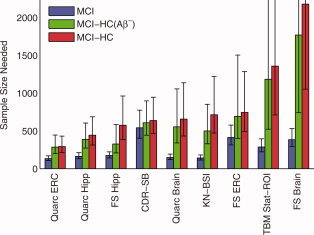
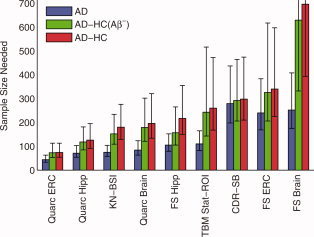
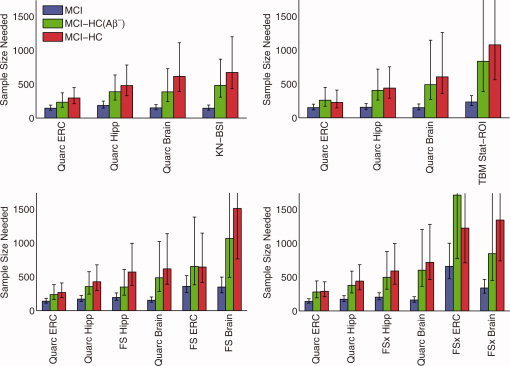
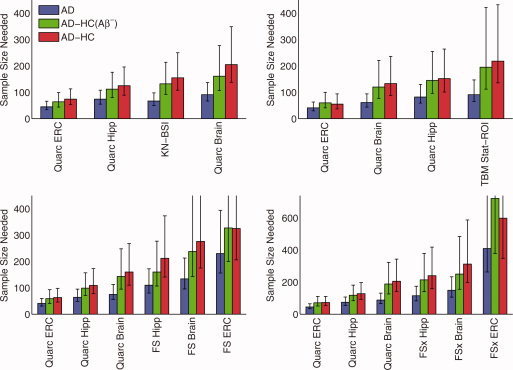
Structural changes in neuroanatomical subregions can be measured using serial magnetic resonance imaging scans, and provide powerful biomarkers for detecting and monitoring Alzheimer's disease. The Alzheimer's Disease Neuroimaging Initiative (ADNI) has made a large database of longitudinal scans available, with one of its primary goals being to explore the utility of structural change measures for assessing treatment effects in clinical trials of putative disease-modifying therapies. Several ADNI-funded research laboratories have calculated such measures from the ADNI database and made their results publicly available. Here, using sample size estimates, we present a comparative analysis of the overall results that come from the application of each laboratory's extensive processing stream to the ADNI database. Obtaining accurate measures of change requires correcting for potential bias due to the measurement methods themselves; and obtaining realistic sample size estimates for treatment response, based on longitudinal imaging measures from natural history studies such as ADNI, requires calibrating measured change in patient cohorts with respect to longitudinal anatomical changes inherent to normal aging. We present results showing that significant longitudinal change is present in healthy control subjects who test negative for amyloid-β pathology. Therefore, sample size estimates as commonly reported from power calculations based on total structural change in patients, rather than change in patients relative to change in healthy controls, are likely to be unrealistically low for treatments targeting amyloid-related pathology. Of all the measures publicly available in ADNI, thinning of the entorhinal cortex quantified with the Quarc methodology provides the most powerful change biomarker.
Copyright © 2011 Wiley Periodicals, Inc.
Figures
References
-
- Aisen PS, Petersen RC, Donohue MC, Gamst A, Raman R, Thomas RG, Walter S, Trojanowski JQ, Shaw LM, Beckett LA, Jack CR, Jr. , Jagust W, Toga AW, Saykin AJ, Morris JC, Green RC, Weiner MW ( 2010): Clinical Core of the Alzheimer's Disease Neuroimaging Initiative: progress and plans. Alzheimers Dement 6: 239–246. - PMC - PubMed
-
- Alexander GE, Chen K, Reiman EM ( 2010): adni_uaspmvbm_ dict_2010–05‐23.csv. www.loni.ucla.edu/ADNI.
-
- Ashburner J, Friston KJ ( 2000): Voxel‐based morphometry–the methods. Neuroimage 11: 805–821. - PubMed
Publication types
MeSH terms
Grants and funding
- K01 AG030514/AG/NIA NIH HHS/United States
- R01 AG031224/AG/NIA NIH HHS/United States
- R01 AG018386/AG/NIA NIH HHS/United States
- P50MH081755/MH/NIMH NIH HHS/United States
- P50 MH081755/MH/NIMH NIH HHS/United States
- P30 AG010129/AG/NIA NIH HHS/United States
- R01AG22381/AG/NIA NIH HHS/United States
- P50NS22343/NS/NINDS NIH HHS/United States
- K01AG029218/AG/NIA NIH HHS/United States
- P50 NS022343/NS/NINDS NIH HHS/United States
- U01 AG024904/AG/NIA NIH HHS/United States
- U19 AG010483/AG/NIA NIH HHS/United States
- R01AG031224/AG/NIA NIH HHS/United States
- R01 AG018384/AG/NIA NIH HHS/United States
- U54 NS056883/NS/NINDS NIH HHS/United States
- U54NS056883/NS/NINDS NIH HHS/United States
- K01 AG029218/AG/NIA NIH HHS/United States
- R01 AG022381/AG/NIA NIH HHS/United States
LinkOut - more resources
Full Text Sources
Medical
