. 2012 Jan;31(1):15-29.
doi: 10.1089/dna.2011.1342. Epub 2011 Aug 10.

Cooperative enhancement of radiosensitivity after combined treatment of 17-(allylamino)-17-demethoxygeldanamycin and celecoxib in human lung and colon cancer cell lines

Affiliations

Cooperative enhancement of radiosensitivity after combined treatment of 17-(allylamino)-17-demethoxygeldanamycin and celecoxib in human lung and colon cancer cell lines

Young-Mee Kim et al. DNA Cell Biol. 2012 Jan.

Abstract

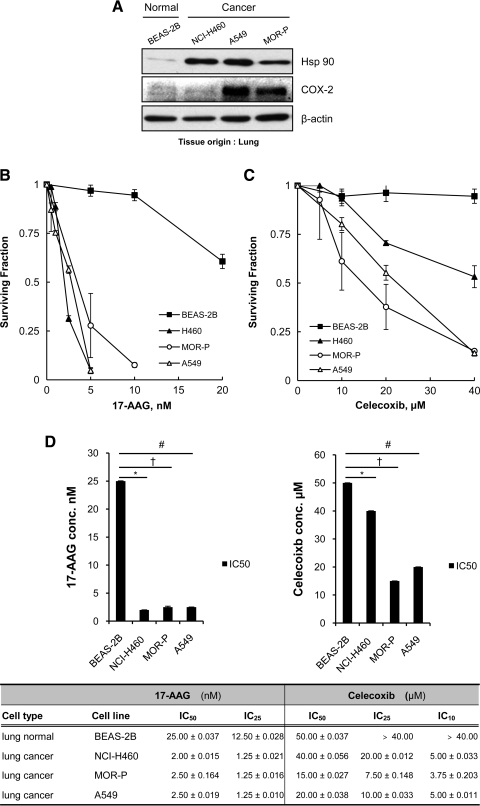
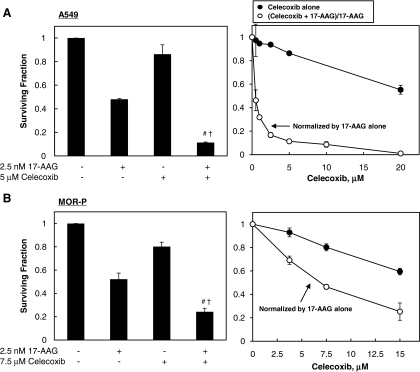
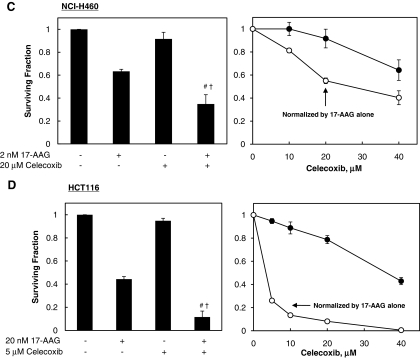
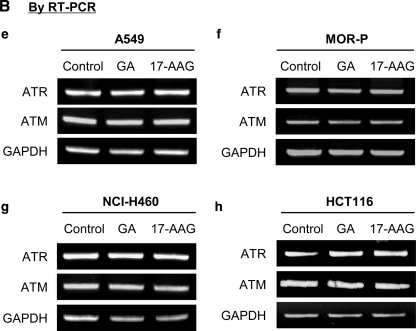
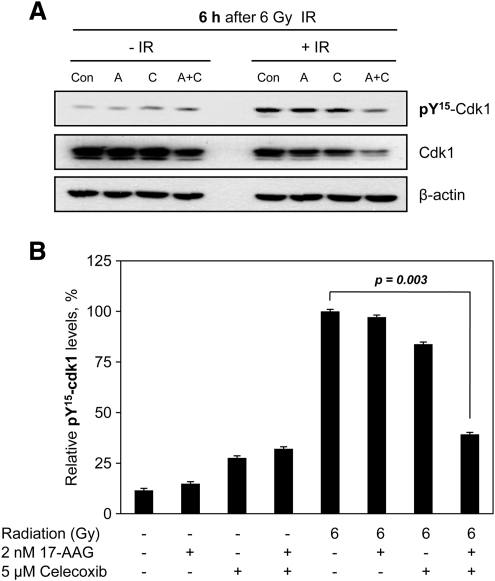
We investigated whether the combined treatment of 17-(allylamino)-17-demethoxygeldanamycin (17-AAG), an inhibitor of heat-shock protein 90 (hsp90), and celecoxib, an inhibitor of cyclooxygenase-2, can cooperatively enhance the radiosensitivity of various human cancer cells. Combined treatment with 17-AAG and celecoxib, at clinically relevant concentrations, cooperatively induced radiosensitization in all tested cancer cells, but not in normal cells. Cooperative radiosensitization by the drug combination was also shown in a human tumor xenograft system. We found that ataxia-telangiectasia and rad3-related (ATR) and ataxia-telangiectasia mutated (ATM) are novel client proteins of hsp90. Combined treatment with 17-AAG and celecoxib cooperatively induced downregulation of ATR and ATM. In conclusion, combined treatment with 17-AAG and celecoxib at clinically relevant concentrations may significantly enhance the therapeutic efficacy of ionizing radiation.


Figures

FIG. 1.
FIG. 1.
Lung cancer cells are more susceptible to 17-(allylamino)-17-demethoxygeldanamycin (17-AAG) and celecoxib than a normal cell line. (A) Basal heat-shock protein 90 (hsp90) and cyclooxygenase-2 (COX-2) expression levels were compared between a normal bronchial cell line (BEAS-2B) and lung cancer cells (NCI-H460, A549, and MOR-P) by western blot analysis. (B, C) Cells were treated with 17-AAG or celecoxib at indicated concentrations for 72 h, and then cell survival was monitored by clonogenic assay. (D) Inhibitory concentrations (IC) of each drug were determined from the data with clonogenic assays. Each IC50 value of 17-AAG and celecoxib was statistically compared between normal and cancer cells. 17-AAG: *p=0.010; p=0.031; #p=0.006. Celecoxib: *p=0.049; p=0.027; #p=0.045. All experiments were performed at least in triplicate and error bars represent±SE.
FIG. 2.
FIG. 2.
The combined treatment of 17-AAG and celecoxib increases cytotoxicity cooperatively in cancer cells but not in a normal cell line. (A–E) Cells were treated with 17-AAG at IC50 for cancer cells (A549, MOR-P, NCI-H460, or HCT-116) and at 2.5 nM (the highest concentration among IC50 of tested cancer cell lines) for the normal BEAS-2B cell line, and celecoxib at indicated concentrations for 72 h and then surviving fraction (SF) was determined by clonogenic assay. The SFs of combined treatment groups with 17-AAG and celecoxib were normalized by that of 17-AAG alone. (F) Cooperatively cytotoxic effects for 17-AAG and celecoxib combination were analyzed by comparing clonogenic death fractions by combined treatment (C) and sum of death fractions by each drug treatment (A+B). All experiments were performed at least in triplicate and error bars represent±SE. “#” and “†,” indicate statistically significant (p<0.05) cooperative effects by combined treatment of 17-AAG and celecoxib when compared to each 17-AAG and celecoxib alone, respectively. ns, nonspecific effect.
FIG. 2.
FIG. 2.
The combined treatment of 17-AAG and celecoxib increases cytotoxicity cooperatively in cancer cells but not in a normal cell line. (A–E) Cells were treated with 17-AAG at IC50 for cancer cells (A549, MOR-P, NCI-H460, or HCT-116) and at 2.5 nM (the highest concentration among IC50 of tested cancer cell lines) for the normal BEAS-2B cell line, and celecoxib at indicated concentrations for 72 h and then surviving fraction (SF) was determined by clonogenic assay. The SFs of combined treatment groups with 17-AAG and celecoxib were normalized by that of 17-AAG alone. (F) Cooperatively cytotoxic effects for 17-AAG and celecoxib combination were analyzed by comparing clonogenic death fractions by combined treatment (C) and sum of death fractions by each drug treatment (A+B). All experiments were performed at least in triplicate and error bars represent±SE. “#” and “†,” indicate statistically significant (p<0.05) cooperative effects by combined treatment of 17-AAG and celecoxib when compared to each 17-AAG and celecoxib alone, respectively. ns, nonspecific effect.
FIG. 3.
FIG. 3.
The combined treatment of 17-AAG and celecoxib shows synergistic radiosensitizing effects in cancer cells but not in a normal cell line. Cells were preincubated with 17-AAG at IC50 or celecoxib at indicated concentrations, or the combination of both drugs for 4 h, exposed to graded doses of γ-radiation, and then SF was determined by clonogenic assay. The SFs of combined groups were normalized by that of drug alone or drug combination. Error bars represent±SE, which was calculated after the pooling of the results of three independent experiments. (A) A549, (B) MOR-P, (C) NCI-H460, (D) HCT116, (E) BEAS-2B.
FIG. 4.
FIG. 4.
The combined treatment 17-AAG and celecoxib cooperatively downregulates protein levels of ataxia-telangiectasia and rad3-related (ATR) and ataxia-telangiectasia mutated (ATM) but not of mRNA. Four cancer cells a, e, and k, A549, b and f, MOR-P, c, g, i, and j. NCI-H460, d and h. HCT116, l, BEAS-2B were incubated with 50 nM geldanamycin (GA) or 17-AAG for indicated times (0, 4, or 8 h) at 37°C. The protein or mRNA levels of ATR or ATM were measured by western blot (A) and by reverse transcription–polymerase chain reaction (RT-PCR) (B), respectively. (C) NCI-H460 cells were incubated with 30 μg/mL cycloheximide with or without 50 nM 17-AAG for 0, 0.5, 1, 2, 4, and 6 h. (D) A549 and BEAS-2B cells were incubated with 2.5 nM 17-AAG, 5 μM celecoxib, or 17-AAG+celecoxib for 24 h at 37°C. The protein levels of ATR, ATM, or β-actin were detected by western blot and quantified using Multi Gauge V3.0 program. All experiments and measurements were done at least in triplicate; 0 h; 0.1% DMSO alone treated.
FIG. 4.
FIG. 4.
The combined treatment 17-AAG and celecoxib cooperatively downregulates protein levels of ataxia-telangiectasia and rad3-related (ATR) and ataxia-telangiectasia mutated (ATM) but not of mRNA. Four cancer cells a, e, and k, A549, b and f, MOR-P, c, g, i, and j. NCI-H460, d and h. HCT116, l, BEAS-2B were incubated with 50 nM geldanamycin (GA) or 17-AAG for indicated times (0, 4, or 8 h) at 37°C. The protein or mRNA levels of ATR or ATM were measured by western blot (A) and by reverse transcription–polymerase chain reaction (RT-PCR) (B), respectively. (C) NCI-H460 cells were incubated with 30 μg/mL cycloheximide with or without 50 nM 17-AAG for 0, 0.5, 1, 2, 4, and 6 h. (D) A549 and BEAS-2B cells were incubated with 2.5 nM 17-AAG, 5 μM celecoxib, or 17-AAG+celecoxib for 24 h at 37°C. The protein levels of ATR, ATM, or β-actin were detected by western blot and quantified using Multi Gauge V3.0 program. All experiments and measurements were done at least in triplicate; 0 h; 0.1% DMSO alone treated.
FIG. 5.
FIG. 5.
The combined treatment of 17-AAG and celecoxib cooperatively decreased level of pTyr15-Cdk1 after ionizing radiation (IR) treatment. NCI-H460 lung cancer cells were pretreated with 2 nM 17-AAG, 5 μM celecoxib, or combination of both drugs for 4 h and then exposed or not to 6 Gy IR. The cells were recovered for 6 h and levels of pTyr15–Cdk1 were determined by western blot analysis (A). Densitometric analysis of pTyr15–Cdk1 level (B). Con, 0.1% DMSO control; A, 2 nM 17-AAG, C, 5 μM celecoxib; A+C, 2 nM 17-AAG+5 μM celecoxib.
FIG. 6.
FIG. 6.
The combined treatment of 17-AAG and celecoxib effectively delayed tumor growth in BALB/C nude mice via enhancing radiosensitivity. (A) NCI-H460 lung cancer cells (4×10⁶ cells/50 μL) were injected into the subcutaneous tissue of the right hind leg as described in Materials and Methods. Tumor-bearing mice were given i.p. with celecoxib (15 mg/kg), 17-AAG (40 mg/kg), or drug combination (celecoxib+17-AAG) for 7 consecutive days after 10 days postimplantation, with or without irradiation on tumor (2 Gy×five times) starting from the next day after drug administration. The mice were monitored every 2–3 days for changes in tumor growth, body weight, and health status. Control groups were given i.p. with equal volume of DMSO. (B) The enhancement factor (EF) ratio was determined at tumor volume 0.6 and 0.8 cm3 as described in Materials and Methods. Error bars represent±SE. The symbols are p<0.05 and represented as follows: * and #—IR alone versus 17-AAG+IR and IR alone versus celecoxib+17-AAG+IR at tumor volume 0.6 cm3; ‡—IR alone versus celecoxib+17-AAG+IR at tumor volume 0.8 cm3.

References

    1. Berenbaum M.C. A method for testing for synergy with any number of agents. J Infect Dis. 1978;137:122–130. - PubMed
    1. Chistiakov D.A. Voronova N.V. Chistiakov P.A. Genetic variations in DNA repair genes, radiosensitivity to cancer and susceptibility to acute tissue reactions in radiotherapy-treated cancer patients. Acta Oncol. 2008;47:809–824. - PubMed
    1. Chou T.C. Theoretical basis, experimental design, and computerized simulation of synergism and antagonism in drug combination studies. Pharmacol Rev. 2006;58:621–681. - PubMed
    1. Davies N.M. McLachlan A.J. Day R.O. Williams K.M. Clinical pharmacokinetics and pharmacodynamics of celecoxib: a selective cyclo-oxygenase-2 inhibitor. Clin Pharmacokinet. 2000;38:225–242. - PubMed
    1. Dittmann K.H. Mayer C. Ohneseit P.A. Raju U. Andratschke N.H. Milas L. Rodemann H.P. Celecoxib induced tumor cell radiosensitization by inhibiting radiation induced nuclear EGFR transport and DNA-repair: a COX-2 independent mechanism. Int J Radiat Oncol Biol Phys. 2008;70:203–212. - PubMed

Publication types

MeSH terms