. 2011 Dec 1;440(2):229-40.
doi: 10.1042/BJ20110641.

Overexpression of a cytosolic pyrophosphatase (TgPPase) reveals a regulatory role of PP(i) in glycolysis for Toxoplasma gondii

Affiliations

Overexpression of a cytosolic pyrophosphatase (TgPPase) reveals a regulatory role of PP(i) in glycolysis for Toxoplasma gondii

Douglas A Pace et al. Biochem J. .

Abstract

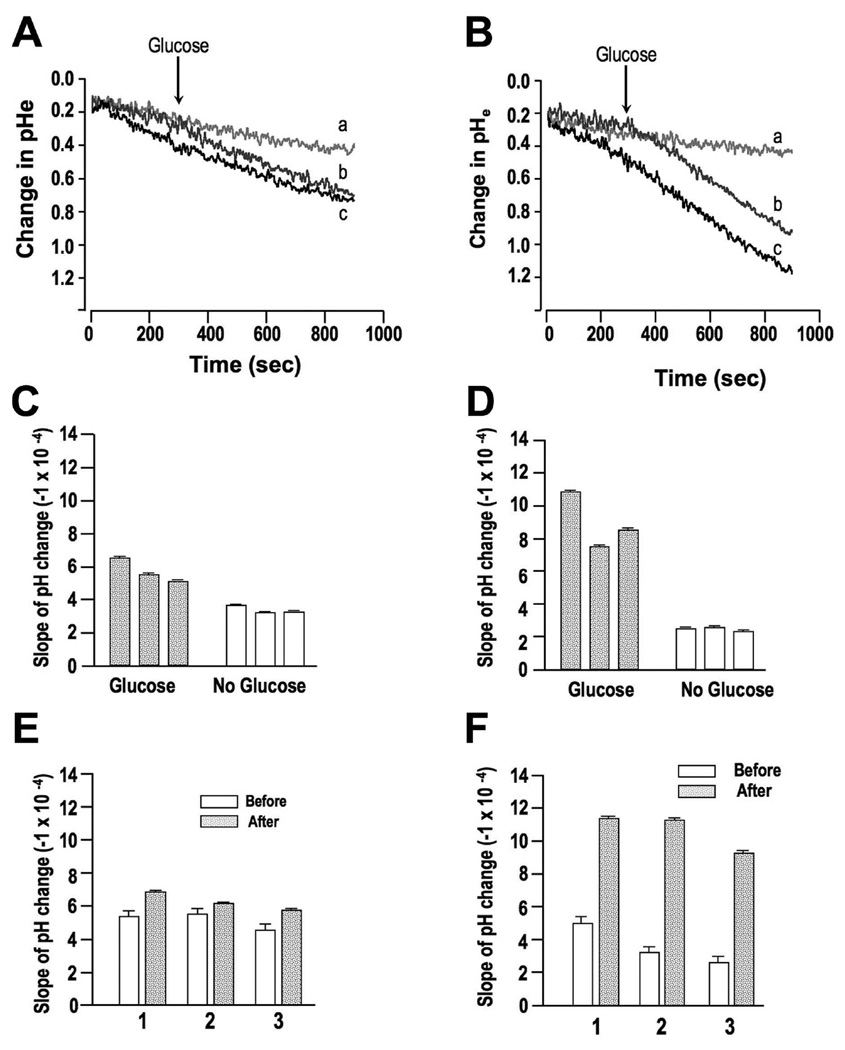
PP(i) is a critical element of cellular metabolism as both an energy donor and as an allosteric regulator of several metabolic pathways. The apicomplexan parasite Toxoplasma gondii uses PP(i) in place of ATP as an energy donor in at least two reactions: the glycolytic PP(i)-dependent PFK (phosphofructokinase) and V-H(+)-PPase [vacuolar H(+)-translocating PPase (pyrophosphatase)]. In the present study, we report the cloning, expression and characterization of cytosolic TgPPase (T. gondii soluble PPase). Amino acid sequence alignment and phylogenetic analysis indicates that the gene encodes a family I soluble PPase. Overexpression of the enzyme in extracellular tachyzoites led to a 6-fold decrease in the cytosolic concentration of PP(i) relative to wild-type strain RH tachyzoites. Unexpectedly, this subsequent reduction in PP(i) was associated with a higher glycolytic flux in the overexpressing mutants, as evidenced by higher rates of proton and lactate extrusion. In addition to elevated glycolytic flux, TgPPase-overexpressing tachyzoites also possessed higher ATP concentrations relative to wild-type RH parasites. These results implicate PP(i) as having a significant regulatory role in glycolysis and, potentially, other downstream processes that regulate growth and cell division.


Figures

Figure 1
Figure 1. Molecular phylogenetic analysis of type I inorganic pyrophosphatases
The consensus phylogenetic tree was built from 100 replicates using the distance and parsimony methods as described in the “Experimental” section. Bootstrap values from 100 replicates are shown in bold and italics as obtained by the distance and parsimonius methods, respectively. The 0.2 bar represents amino acid substitutions per site. The sequence accession numbers as provided by GenBank are indicated in parentheses: Aquifex aeolicus VF5 (NP_214066.1), Arabidopsis thaliana chloroplast PPase (At5g09650.1), A. thaliana (At1g01050.1), Chlamydomonas reinhardtii mitochondrial PPase (AJ298232), C. reinhardtii chloroplast PPase (AJ298231), Cryptosporidium parvum (cgd4_1400), Escherichia coli W3110 (NP_418647.1), Homo sapiens cytosolic PPase (ENSP00000317687), H. sapiens mitochondrial PPase (ENSP00000343885), Kluyveromyces lactis cyotosolic PPase (KLLA0E17721g), K. lactis mitochondrial PPase (KLLA0E11055g), Leishmania major putative mitochondrial PPase (LmjF03.0910), Mus musculus cytosolic PPase (ENSMUSP00000020286), M. musculus mitochondrial PPase (BAB22922), Nostoc sp. PCC7120 (P80562), Oriza sativa chloroplast PPase (3698.m00155), O. sativa (12001.m13461), Plasmodium falciparum 3D7 (PFC0710w), Rhodospirillum rubrum (AF115341_1), Saccharomyces cerevisiae cytosolic PPase (YBR011C), S. cerevisiae mitochondrial PPase (YMR267W), Solanum tuberosum (CAA12415), Synechocystis PCC6803 (P80507), Thermoplasma acidophilum (P37981), Thermus thermophilus (BAA24521), Toxoplasma gondii (AAU88181), Trypanosoma brucei putative mitochondrial PPase (Tb927.3.2840/Tb03.27C5.190), T. cruzi putative mitochondrial PPase (Tc00.1047053508181.140) and Zea mays (O48556). MIT, mitochondrial, CYT, cytosolic, CHL, chloroplastic.
Figure 2
Figure 2. Enzymatic characterization of the rTgPPase
PPase activity was determined as described under “Experimental” using 23 µM PPi (A, C), or 9 µM poly P3 (B, D). A, B Optimun pH measurements with PPi (A) or Poly P3 (B) as substrate. A 20mM Tris/HEPES mixed buffering system was used to manipulate the pH of the reaction buffer. C, D, Optimun cation concentrations measurements with PPi (C) or Poly P3 (D) as substrate. Results are expressed as % of maximum activity taken as 100%. Where indicated, 5 mM EDTA was used. E,F, enzymatic activity measured with different concentracions of PPi (E) or PolyP3 (F). These experiments were done using 3.0 mM MgCl2, (E), or 3 mM CoCl2 (F). Insets represent the linear transformation, by double reciprocal plot, of each curve. Experiments were repeated three times, each one in triplicate, with similar results.
Figure 3
Figure 3. The TgPPase localizes to the cytosol of RH, wild type T. gondii tachyzoites
RH (wildtype) tachyzoites expressing YFP were used [30] to test for colocalization of endogenous expression of TgPPase. (A) TgPPase localized to the cytosoplasm of RH tachyzoites. Parasites were fixed and stained with an anti-TgPPase antibody (1:100) or observed by direct YFP fluorescence where indicated. The overlay images show co-localization of both proteins in the cytosol. Scale bars = 5 µm. (B) Western blot analysis of subcellular fractions of T. gondii tachyzoites. Equal protein amounts (5 µg) from supernatant (“S”) and pellet (“P”) fractions were loaded. The molecular mass standards (in kDa) are shown on the left. (C, D) Specific and total enzymatic activity, respectively, in supernatant (“S”) and pellet (“P”) fractions after centrifugation of lysates at 100,000×g for 1 h. Other experimental details are described under “Experimental”.
Figure 4
Figure 4. Cells overexpressing TgPPase show higher levels of TgPPase protein and activity but grow at a slower rate
A, Western blot analysis. RH cells; OE, cells transfected with the expression vector ptubTgPPase-flag/sagCAT and selected with chloramphenicol as indicated under “Experimental” (TgPPase-OE cells). The blot was sequentially probed with anti-TgPPase antibody (upper panel) and anti-α-tubulin antibody as loading control (bottom panel). B, PPase activity of crude cell lysates obtained as described under “Experimental”. AMDP, a specific inhibitor of the vacuolar proton PPase (V-H+-PPase) at 40 µM, was added to the lysate. C, OE mutant tachyzoites had significantly lower [3H]-uracil incorporation than wild-type cells after 24 h inoculation of hTERT host cells. The results are representative of three independent experiments, each one performed in triplicate. The bars are the means ± S.D. Asterisks (*) show P values < 0.05, determined by the Student’s t-test. D-F, Plaque assays comparing growth and invasion ability of wild type cells (RH) and TgPPase over expressing mutants (OE). D, Determination of plaque forming units in a monolayer of hTERT host cells. 200 parasites were incubated in each well for 9 days, washed away and remaining host cells were stained to determine the number of zones cleared of host cell due to parasite invasion and replication (i.e., plaques). Values shown are averages (± SE), N = 6. E, Determination of relative area of plaques. Data taken from same experiments as shown in panel D. Area represents the percent of the total available area that the average plaque occupied. Singe factor ANOVA (df = 1, 11) showed significantly lower plaque numbers and plaque area in OE mutant cells. * = P < 0.05; *** = P < 0.001. F, Representative wells used to determine plaquing efficiency for RH and TgPPase OE mutant parasites.
Figure 5
Figure 5. T. gondii parasites overexpressing TgPPase (OE) contain lower PPi and higher ATP levels
A, Over-expression of TgPPase leads to a significant reduction in total PPi levels as compared with wild-type RH tachyzoites (ANOVA, df = 1,16; P < 0.01). Bars represent the average (± SE) of 9 quantifications for each cell type. B, No difference in short chain poly P levels between wild type RH and OE mutants for TgPPase. Bars represent the average of 9 determinations for each cell type. Values are in phosphate equivalents of hydrolyzed short chain poly P groups. C, Over-expression of TgPPase leads to an increase in the intracellular levels of ATP in the presence of glucose. Newly released tachyzoites were filtered and washed twice with BAG with or without glucose and incubated in the same buffer for 1 hour. ATP was extracted and measured as described under “Experimental”. The results are representative of three independent experiments, each one performed in triplicate. The bars are the means ± S.D. Asterisks (*) show P values < 0.05, determined by the Student’s t-test.
Figure 6
Figure 6. PPi content of cytosolic and acidocalcisome fractions
PPi was determined in cytosol (A) and 17,000G pellet (acidocalcisome) fractions obtained as described under “Experimental” from wild type (RH) and TgPPase-OE parasites (OE). Bars represent average concentration (± SE) of 3 quantifications for each cell type. Where no error bars are present the bars fall within the graphical representation of the average value. Concentration was determined by dividing the total nmol PPI in the cytosolic and organellar fractions by their respective estimated volumes as described under “Experimental”. *Cytosolic PPi concentration was significantly lower in OE mutants (ANOVA, df = 1, 4; P < 0.01).
Figure 7
Figure 7. Proton extrusion by wild type (RH) and TgPPase-OE (OE) parasites
Rates of proton extrusion were measured using the free acid form of BCECF. A, C, and E, summary of proton extrusion in RH cells. B, D, and F, summary of proton extrusion in OE mutant cells. A, representative tracings depicting changes in extracellular pH (pHe) in RH tachyzoites in the presence of 5 mM glucose (black, trace c), no glucose (light gray, trace a), and in cells where 5 mM glucose was added 300 seconds into recording (dark gray, trace b). B, same tracing as in A using OE mutants. C, resultant slope values (change in pHe per second) in the presence (gray bars) or absence of glucose (open bars) for proton extrusion in RH cells using data represented in tracings ‘a’ and ‘c’ in panel A. D, resultant slope values (change in pHe per second) in the presence (gray bars) or absence of glucose (open bars) for proton extrusion in OE mutant cells using data represented in tracings ‘a’ and ‘c’ in panel B. E, rate of pHe change before (open bars) and after (gray bars) addition of 5 mM glucose to media in RH cells using data represented in tracing ‘b’ in panel A. F, rate of pHe change before (open bars) and after (gray bars) addition of 5 mM glucose to media in OE mutant cells using data represented in tracing ‘b’ in panel B. All estimates shown in panels C-F were determined from three independent experiments and error bars represent the standard error of the slope.
Figure 8
Figure 8. Lactate extrusion in wild type (RH) and TgPPase-OE (OE) parasites
Lactate extrusion rates were measured using an enzyme-coupled reaction (LDH) fluorescently monitoring the production of NADH as lactate is converted to pyruvate. Lactate extrusion was monitored in RH (open circles) and OE mutant (gray circles) tachyzoites with duplicate samples taken at 0, 1, 2, 5, and 10 minutes for each cell type. Regression analysis was performed on each cell type and the resultant slope, depicting the rate of lactate extrusion, is shown in the inset as the cell-specific rate of lactate extrusion. Error bars are the standard error of the slope. * P < 0.001; ANOVA comparison of slopes between RH and TgPPase-OE cells (df = 1,18; F value = 253).

Similar articles

Cited by

References

    1. Kornberg A. On the metabolic significance of phosphorolytic and pyrophosphorolytic reactions. In: Kasha HaPB., editor. Horizons in Biochemistry. New York: Academic Press, Inc.; 1962. pp. 251–264.
    1. Mansurova SE. Inorganic pyrophosphate in mitochondrial metabolism. Biochim Biophys Acta. 1989;977:237–247. - PubMed
    1. Lahti R. Microbial inorganic pyrophosphatases. Microbiol Rev. 1983;47:169–178. - PMC - PubMed
    1. Veech RL, Cook GA, King MT. Relationship of free cytoplasmic pyrophosphate to liver glucose content and total pyrophosphate to cytoplasmic phosphorylation potential. FEBS Lett. 1980;117(Suppl):K65–K72. - PubMed
    1. Baltscheffsky M, Schultz A, Baltscheffsky H. H+ -PPases: a tightly membrane-bound family. FEBS Lett. 1999;457:527–533. - PubMed

Publication types

Substances

Associated data