

Demography and ecology drive variation in cooperation across human populations
- PMID: 21831836
- PMCID: PMC3167540
- DOI: 10.1073/pnas.1105186108
Demography and ecology drive variation in cooperation across human populations
Abstract
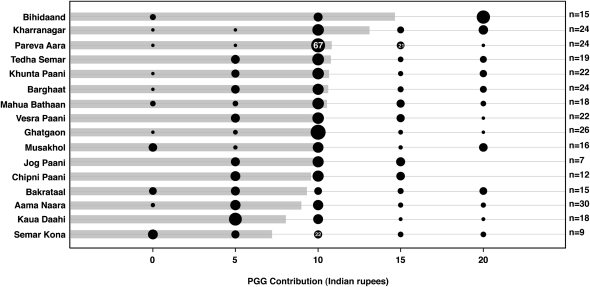
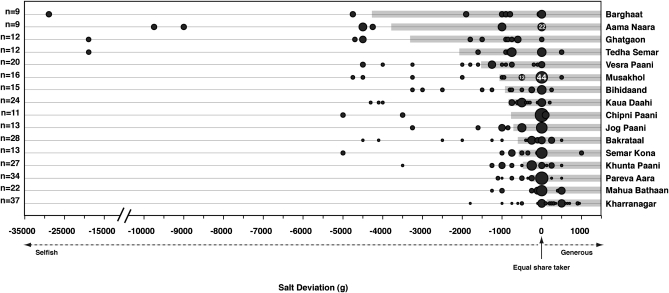
Recent studies argue that cross-cultural variation in human cooperation supports cultural group selection models of the evolution of large-scale cooperation. However, these studies confound cultural and environmental differences between populations by predominantly sampling one population per society. Here, we test the hypothesis that behavioral variation between populations is driven by environmental differences in demography and ecology. We use a public goods game played with money and a naturalistic measure of behavior involving the distribution of salt, an essential and locally valued resource, to demonstrate significant variation in levels of cooperation across 16 discrete populations of the same small-scale society, the Pahari Korwa of central India. Variation between these populations of the same cultural group is comparable to that found between different cultural groups in previous studies. Demographic factors partly explain this variation; age and a measure of social network size are associated with contributions in the public goods game, while population size and the number of adult sisters residing in the population are associated with decisions regarding salt. That behavioral variation is at least partly contingent on environmental differences between populations questions the existence of stable norms of cooperation. Hence, our findings call for reinterpretation of cross-cultural data on cooperation. Although cultural group selection could theoretically explain the evolution of large-scale cooperation, our results make clear that existing cross-cultural data cannot be taken as empirical support for this hypothesis.
Conflict of interest statement
The authors declare no conflict of interest.
Figures
Comment in
-
Culture does account for variation in game behavior.Proc Natl Acad Sci U S A. 2012 Jan 10;109(2):E32-3; author reply E34. doi: 10.1073/pnas.1118607109. Epub 2012 Jan 4. Proc Natl Acad Sci U S A. 2012. PMID: 22219355 Free PMC article. No abstract available.
References
-
- Henrich J, et al. “Economic man” in cross-cultural perspective: Behavioral experiments in 15 small-scale societies. Behav Brain Sci. 2005;28:795–815. discussion 815–855. - PubMed
-
- Henrich J, et al. Costly punishment across human societies. Science. 2006;312:1767–1770. - PubMed
-
- Henrich J, et al. Markets, religion, community size, and the evolution of fairness and punishment. Science. 2010;327:1480–1484. - PubMed
-
- Herrmann B, Thöni C, Gächter S. Antisocial punishment across societies. Science. 2008;319:1362–1367. - PubMed
-
- Roth AE, Prasnikar V, Okuno-Fujiwara M, Zamir S. Bargaining and market behavior in Jerusalem, Ljubljana, Pittsburgh, and Tokyo: An experimental study. Am Econ Rev. 1991;81:1068–1095.
Publication types
MeSH terms
LinkOut - more resources
Full Text Sources
Miscellaneous
