. 2012 Mar 7;9(68):456-69.
doi: 10.1098/rsif.2011.0379. Epub 2011 Aug 10.

Methods to infer transmission risk factors in complex outbreak data

Affiliations

Methods to infer transmission risk factors in complex outbreak data

Simon Cauchemez et al. J R Soc Interface. .

Abstract

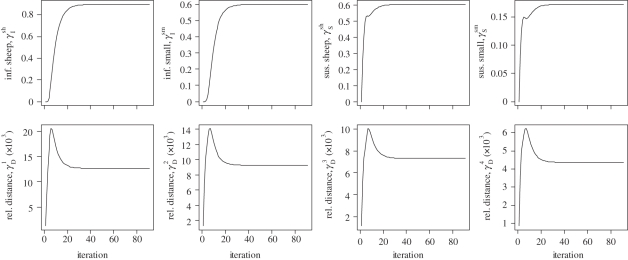
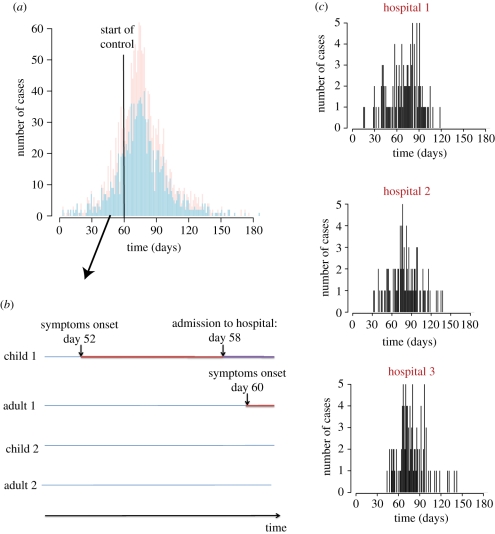
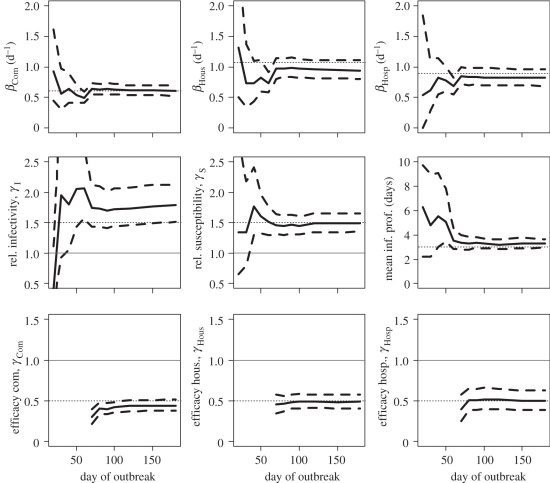
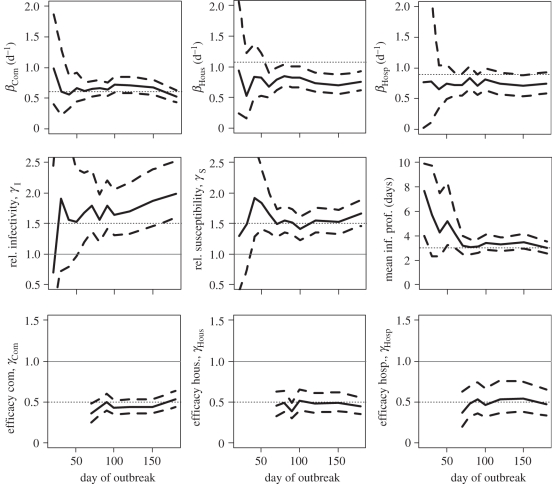
Data collected during outbreaks are essential to better understand infectious disease transmission and design effective control strategies. But analysis of such data is challenging owing to the dependency between observations that is typically observed in an outbreak and to missing data. In this paper, we discuss strategies to tackle some of the ongoing challenges in the analysis of outbreak data. We present a relatively generic statistical model for the estimation of transmission risk factors, and discuss algorithms to estimate its parameters for different levels of missing data. We look at the problem of computational times for relatively large datasets and show how they can be reduced by appropriate use of discretization, sufficient statistics and some simple assumptions on the natural history of the disease. We also discuss approaches to integrate parametric model fitting and tree reconstruction methods in coherent statistical analyses. The methods are tested on both real and simulated datasets of large outbreaks in structured populations.


Figures

Figure 1.
Figure 1.
Convergence of the ECM algorithm for model M1.
Figure 2.
Figure 2.
Simulated epidemic and information collected during the epidemic. (a) Epidemic curve. (b) Follow-up of households. (c) Follow-up of outbreaks in hospitals. Pink, child; light blue, adult.
Figure 3.
Figure 3.
Estimates of transmission rates and relative transmission risk factors as a function of the number of days since the outbreak started when all cases are detected. Solid line, posterior mean; dashed line, 95% Credible Interval; dotted line, simulation value. For parameters used to compare groups (e.g. relative susceptibility, efficacy of interventions, etc.), we have also added a thin horizontal line y = 1. Top row gives estimates of the transmission rates in the different settings. Middle row gives estimates of the relative infectivity and relative susceptibility of children and the mean duration characterizing the infectivity profile. Bottom row gives the estimates of the efficacy of intervention to reduce transmission rates in the different settings.
Figure 4.
Figure 4.
Estimates of transmission rates and relative transmission risk factors as a function of the number of days since the outbreak started when 50% of cases are detected in the community and in the hospital, and when 90% of cases among household contacts of detected cases are detected. Solid line, posterior mean; dashed line, 95% credible interval; dotted line, simulation value. For parameters used to compare groups (e.g. relative susceptibility, efficacy of interventions, etc.), we have also added a thin horizontal line y = 1. Top row gives estimates of the transmission rates in the different settings. Middle row gives estimates of the relative infectivity and relative susceptibility of children and the mean duration characterizing the infectivity profile. Bottom row gives the estimates of the efficacy of intervention to reduce transmission rates in the different settings.
Figure 5.
Figure 5.
Summary statistics derived from the tree reconstruction. (a) Disaggregated monitoring of the reproduction number in the community, the household and the hospital based on the reconstructed transmission tree. Blue point, posterior mean; light blue line, 95% credible interval; red line, time when control measures were implemented. (b) Reconstructed cumulated number of cases infected in the different settings. (c) Reconstructed weekly proportion of cases infected in the different settings. (b,c) Solid line, community; dashed line, household; dotted line, hospital.

References

    1. Gilks W. R., Richardson S., Spiegelhalter D. J. 1996. Markov Chain Monte Carlo in practice. London, UK: Chapman and Hall
    1. Andersson H., Britton T. 2000. Stochastic epidemic models and their statistical analysis. New York, NY: Springer
    1. Becker N. G., Britton T. 1999. Statistical studies of infectious disease incidence. J. R. Stat. Soc. B 61, 287–30710.1111/1467-9868.00177 (doi:10.1111/1467-9868.00177) - DOI - DOI
    1. O'Neill P. D. 2002. A tutorial introduction to Bayesian inference for stochastic epidemic models using Markov chain Monte Carlo methods. Math. Biosci. 180, 103–11410.1016/S0025-5564(02)00109-8 (doi:10.1016/S0025-5564(02)00109-8) - DOI - DOI - PubMed
    1. O'Neill P. D., Balding D. J., Becker N. G., Eerola M., Mollison D. 2000. Analyses of infectious disease data from household outbreaks by Markov chain Monte Carlo methods. J. R. Stat. Soc. C 49, 517–54210.1111/1467-9876.00210 (doi:10.1111/1467-9876.00210) - DOI - DOI

Publication types

LinkOut - more resources