. 2011 Nov;339(2):607-17.
doi: 10.1124/jpet.111.181206. Epub 2011 Aug 10.

Perinatal exposure to Δ9-tetrahydrocannabinol triggers profound defects in T cell differentiation and function in fetal and postnatal stages of life, including decreased responsiveness to HIV antigens

Affiliations

Perinatal exposure to Δ9-tetrahydrocannabinol triggers profound defects in T cell differentiation and function in fetal and postnatal stages of life, including decreased responsiveness to HIV antigens

Catherine Lombard et al. J Pharmacol Exp Ther. 2011 Nov.

Abstract

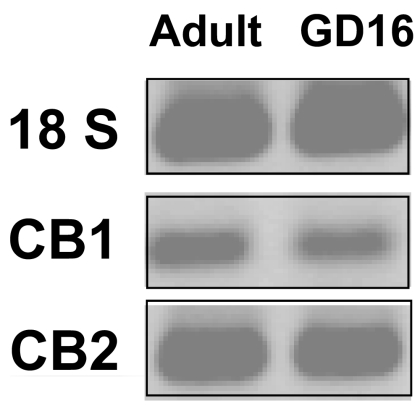
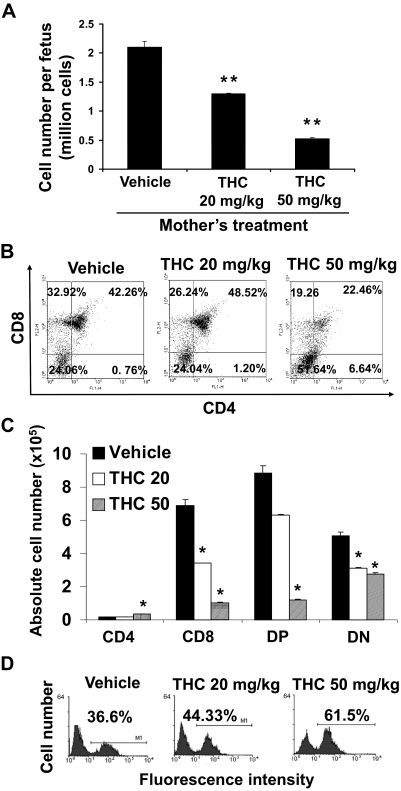
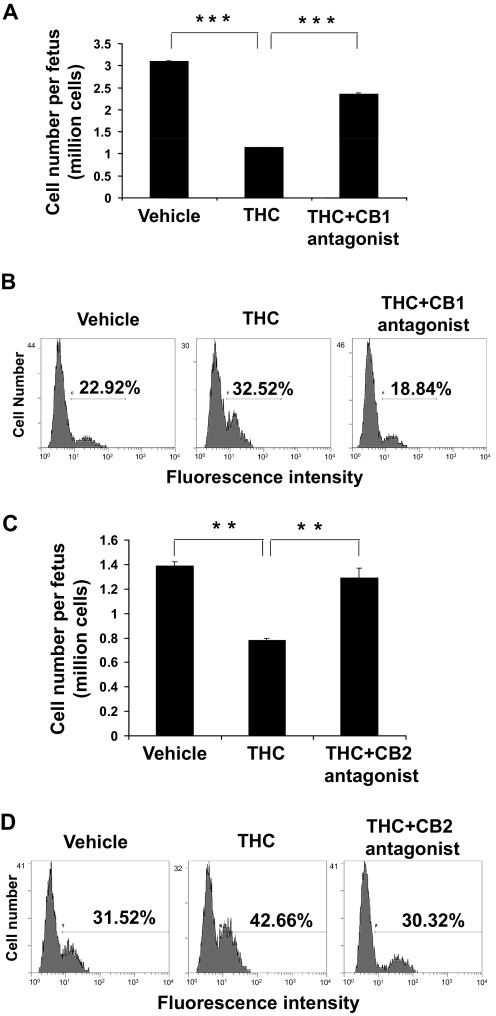
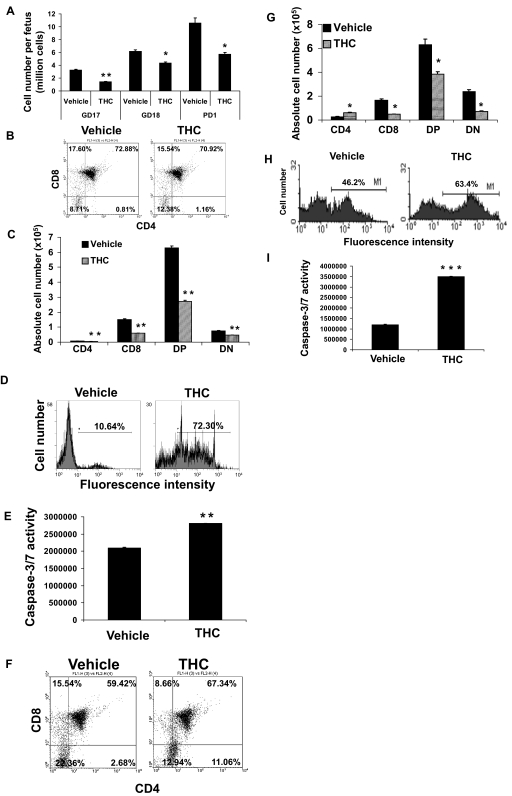
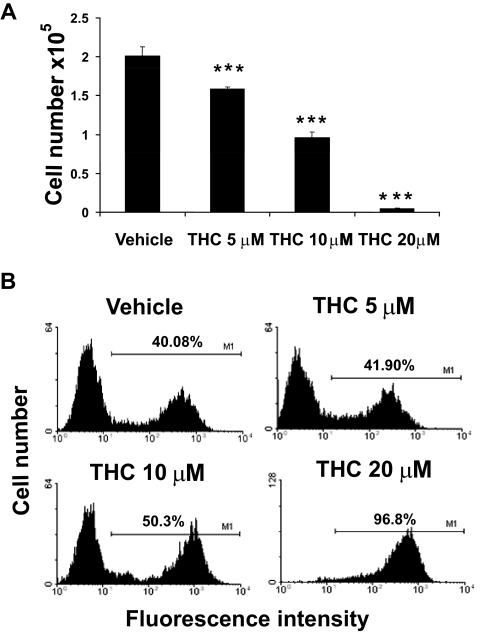
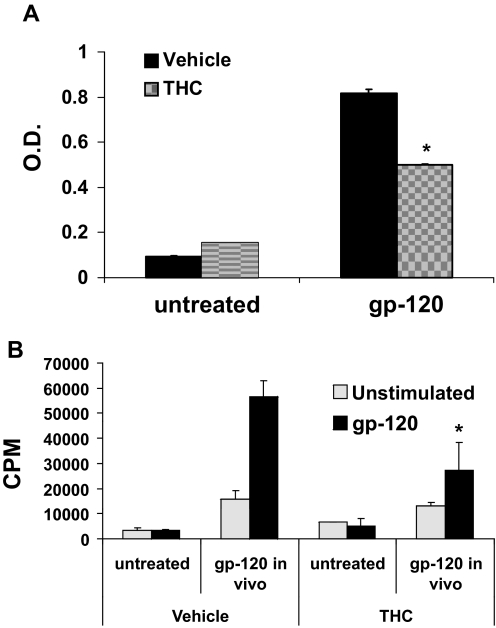
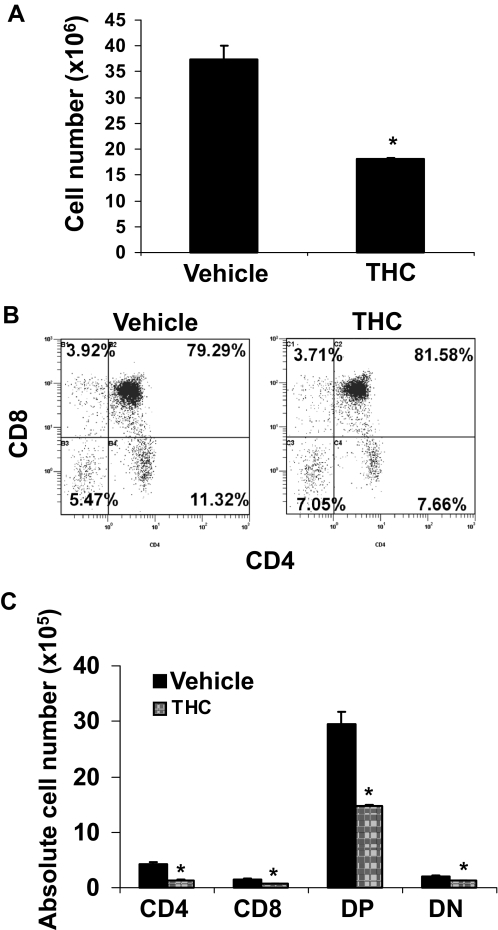
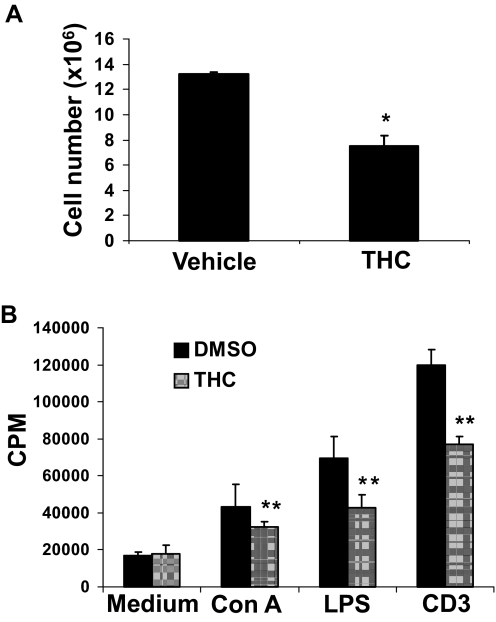
Marijuana abuse is very prominent among pregnant women. Although marijuana cannabinoids have been shown to exert immunosuppression in adults, virtually nothing is known about the effects of marijuana use during pregnancy on the developing immune system of the fetus and during postnatal life. We noted that murine fetal thymus expressed high levels of the cannabinoid receptors CB1 and CB2. Moreover, perinatal exposure to Δ(9)-tetrahydrocannabinol (THC) had a profound effect on the fetus as evidenced by a decrease in thymic cellularity on gestational days 16, 17, and 18 and postgestational day 1 and marked alterations in T cell subpopulations. These outcomes were reversed by CB1/CB2 antagonists, suggesting that THC-mediated these effects through cannabinoid receptors. Thymic atrophy induced in the fetus correlated with caspase-dependent apoptosis in thymocytes. Thymic atrophy was the result of direct action of THC and not based on maternal factors inasmuch as THC was able to induce T cell apoptosis in vitro in fetal thymic organ cultures. It is noteworthy that perinatal exposure to THC also had a profound effect on the immune response during postnatal life. Peripheral T cells from such mice showed decreased proliferative response to T cell mitogen as well as both T cell and antibody response to HIV-1 p17/p24/gp120 antigens. Together, our data demonstrate for the first time that perinatal exposure to THC triggers profound T cell dysfunction, thereby suggesting that the offspring of marijuana abusers who have been exposed to THC in utero may be at a higher risk of exhibiting immune dysfunction and contracting infectious diseases including HIV.


Figures

Fig. 1.
Fig. 1.
Fetal thymocytes express cannabinoid receptors. Fetal thymocytes were harvested on GD16. RNA was extracted and used for RT-PCR to check the expression of CB1 and CB2. The amplicons were run on a 1% agarose gel and visualized with ethidium bromide. 18S was used as an internal control. RNA from adult thymocytes was used as a positive control for CB1 and CB2 expression.
Fig. 2.
Fig. 2.
Perinatal exposure to THC alters fetal thymic development. Groups of two C57BL/6 pregnant mice (n = 2) were injected on GD16 with THC (20 or 50 mg/kg) or vehicle. On GD17, the thymi from the fetuses were harvested. Thymi of fetuses from each pregnant mouse (average 10) were pooled separately for analysis. A, thymic cellularity was determined by trypan blue dye exclusion. The data represent the mean thymic cellularity per fetus ± S.E.M., p = 0.0062, one-way ANOVA. **, statistically significant difference from vehicle control (p < 0.01). B, the thymocytes were double-stained with FITC-anti-CD4 and PE-anti-CD8 mAbs and analyzed by flow cytometry. Representative dot plots are shown where the percentage of cells in each subset is depicted on each dot plot. C, absolute numbers of cells for each subset per fetus are shown and expressed as mean ± S.E.M. *, statistically significant difference (p < 0.05) in the mean cellularity of THC-exposed thymocytes compared with the vehicle control. D, the thymocytes were analyzed for apoptosis using the TUNEL method followed by flow cytometric analysis as described under Materials and Methods. The percentage of apoptotic cells is depicted in each histogram.
Fig. 3.
Fig. 3.
THC-induced apoptosis in the fetal thymus is mediated through both CB1 and CB2. On GD16, groups of two C57BL/6 pregnant mice (n = 2) were pretreated with CB1 (SR141716A) (A and B) or CB2 (AM630) (C and D) antagonist followed by injection with 50 mg/kg THC or the vehicle. A and C, on GD17, the thymi from the fetuses of each mother (average 10) were pooled and analyzed for viable cells as described in Fig. 2. The data represent the mean thymic cellularity per fetus ± S.E.M. A, ***, p < 0.0001, one-way ANOVA. C, p = 0.0062 one-way ANOVA. Asterisks indicate statistically significant difference (**, p < 0.05) in the mean cellularity in THC + antagonist group compared with THC-treated group and in the THC-treated group compared with vehicle-treated group. B and D, the thymocytes were analyzed for apoptosis using the TUNEL followed by flow cytometric analysis. The percentage of apoptotic cells is depicted in each histogram.
Fig. 4.
Fig. 4.
THC-induced thymic atrophy and alteration of T cell subsets persist until birth. Groups of two C57BL/6 pregnant mice (n = 2) were injected on GD16 with 50 mg/kg THC or vehicle. On GD17 (A), GD18 (A–E), and PD1 (A, F–I), the thymi from the fetuses or pups (average 10) from each mother were harvested and pooled. A, viable thymic cellularity was determined by trypan blue dye exclusion. The data represent the mean thymic cellularity per fetus/pup ± S.E.M. B, C, F, and G, the thymocytes were double-stained with FITC-anti-CD4 and PE-anti-CD8 mAbs and analyzed by flow cytometry. Representative dot plots are shown in B and F where the percentage of cells in each subset is depicted on each dot plot. Absolute numbers of cells found in each subset are shown in C and G. D and H, thymocytes were analyzed for apoptosis using TUNEL followed by flow cytometric analysis. The percentage of apoptotic cells is depicted in each histogram. E and I, the thymocytes were analyzed for levels of caspase-3 and caspase-7 activity as described under Materials and Methods. The results are depicted as mean ± S.E.M. A, C, E, G, and I, statistically significant difference between vehicle control and THC treatment group by two-tailed unpaired Student's t test (*, p ≤ 0.05; **, p ≤ 0.01; ***, p ≤ 0.001).
Fig. 5.
Fig. 5.
Effects of THC on FTOCs. FTOCs were prepared and exposed to THC or the vehicle as described under Materials and Methods. Thymi from fetuses of each mother were plated with up to six thymic lobes/well, and at the time of harvesting lobes from each well were pooled to prepare cell suspensions. Three such wells were used for each in vitro treatment. On day 6, thymic lobes were harvested and pooled. A, cell viability was determined using the trypan blue dye exclusion method. The data represent the mean thymic cellularity per organ ± S.E.M. ***, p ≤ 0.001, statistically significant difference in the mean cellularity of THC-exposed FTOCs compared with the vehicle control by one-way ANOVA. B, the cells were analyzed for apoptosis using the TUNEL method followed by flow cytometry. The percentage of apoptotic cells is depicted on each histogram.
Fig. 6.
Fig. 6.
Effect of acute perinatal exposure to THC on the immune response of postnatal 5 weeks of age to gp120. Groups of two C57BL/6 pregnant mice (n = 2) were injected with 50 mg/kg THC or vehicle on GD16. Five weeks after the pups were born, they were injected in each rear footpad with 5 μg of HIV-1 p17/p24/gp120 emulsified in CFA. After 1 week, sera (A) and draining LNs (B) were collected. A, sera were analyzed for the presence of HIV-1 p27/p24/gp120-specific IgG by ELISA. B, the draining LN cells were left unstimulated or restimulated with 25 μg/ml of HIV-1 p17/p24/gp120 for 72 h. During the final 8 h, the cells were pulsed with 2 μCi of [3H]thymidine. Thymidine incorporation was determined by β-scintillation counting. The data represent mean ± S.E.M. of triplicate cultures. *, statistically significant differences, p ≤ 0.05. A, one-way ANOVA, interaction, p = 0.0005; DMSO vehicle versus THC, p = 0.017; untreated versus gp120, p < 0.0001. B, one-way ANOVA, interaction not significant; DMSO versus THC, not significant; untreated versus gp120, p = 0.0016.
Fig. 7.
Fig. 7.
Effect of subchronic perinatal exposure to THC on the thymus of 1-week-old pups. Groups of two C57BL/6 pregnant mice (n = 2) were injected with 25 mg/kg THC or vehicle on GD16 and 10 mg/ml THC or the vehicle every day thereafter until they delivered the pups (for a total of four injections, or 55 mg/kg THC). One week after the pups were born, the thymi were harvested and pooled for each mother (average 10 pups per mother). A, thymic cellularity was determined by the trypan blue dye exclusion method. The data represent mean thymic cellularity per pup + S.E.M. *, statistically significant difference compared with the vehicle control, p = 0.0196 by two-tailed unpaired Student's t test. B and C, the thymocytes were double-stained with FITC-anti-CD4 and PE-anti-CD8 mAbs and analyzed by flow cytometry. Representative dot plots are shown in B where the percentage of cells in each subset is depicted on each dot plot. Absolute numbers of cells found in each subset are shown in C. * denotes statistically significant difference compared with the vehicle control by two-tailed unpaired t test. CD4, p = 0.0116; CD8, p = 0.0178; DP, p = 0.0206; DN: p = 0.0362.
Fig. 8.
Fig. 8.
Effect of subchronic perinatal exposure to THC on the spleen of 1-week-old pups. Groups of two C57BL/6 pregnant mice (n = 2) were injected with 25 mg/kg THC or vehicle on GD16 and 10 mg/ml THC or the vehicle every day thereafter until they delivered the pups (for a total of four injections, or 55 mg/kg THC). One week after the pups were born, the spleens were harvested and pooled for each mother (average 10 pups per mother). A, splenic cellularity was determined by the trypan blue dye exclusion method. The data represent mean thymic cellularity per pup ± S.E.M. * denotes statistically significant difference compared with the vehicle control, p = 0.0201 by two-tailed unpaired Student's t test. B, the cells were left unstimulated or stimulated with Con A, LPS, or anti-CD3 mAb for 48 h. During the final 8 h, the cells were pulsed with 2 μCi of [3H]thymidine. Thymidine incorporation was determined by β-scintillation counting. The data represent mean ± S.E.M. of triplicate cultures. **, p ≤ 0.01 statistically significant difference. Two-way ANOVA, overall interaction not significant; medium versus stimulus, p < 0.0001, DMSO versus THC, p = 0.021.

Similar articles

Cited by

References

    1. Azorlosa JL, Heishman SJ, Stitzer ML, Mahaffey JM. (1992) Marijuana smoking: effect of varying Δ9-tetrahydrocannabinol content and number of puffs. J Pharmacol Exp Ther 261:114–122 - PubMed
    1. Beal JE, Olson R, Laubenstein L, Morales JO, Bellman P, Yangco B, Lefkowitz L, Plasse TF, Shepard KV. (1995) Dronabinol as a treatment for anorexia associated with weight loss in patients with AIDS. J Pain Symptom Manage 10:89–97 - PubMed
    1. Berdyshev EV. (2000) Cannabinoid receptors and the regulation of immune response. Chem Phys Lipids 108:169–190 - PubMed
    1. Bluhm EC, Daniels J, Pollock BH, Olshan AF, and Children's Oncology Group (United States) (2006) Maternal use of recreational drugs and neuroblastoma in offspring: a report from the Children's Oncology Group (United States). Cancer Causes Control 17:663–669 - PubMed
    1. Bonnin A, de Miguel R, Hernández ML, Ramos JA, Fernández-Ruiz JJ. (1995) The prenatal exposure to Δ9-tetrahydrocannabinol affects the gene expression and the activity of tyrosine hydroxylase during early brain development. Life Sci 56:2177–2184 - PubMed

Publication types

MeSH terms

LinkOut - more resources