. 2011 Nov;106(5):2346-57.
doi: 10.1152/jn.01100.2010. Epub 2011 Aug 10.

Spinal locomotor inputs to individually identified reticulospinal neurons in the lamprey

Affiliations

Spinal locomotor inputs to individually identified reticulospinal neurons in the lamprey

James T Buchanan. J Neurophysiol. 2011 Nov.

Abstract

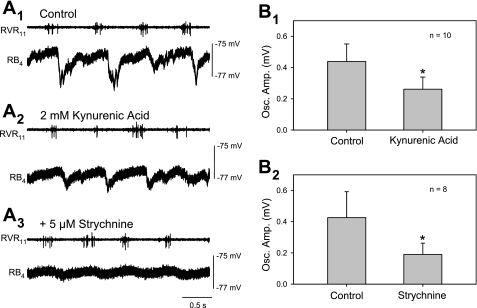
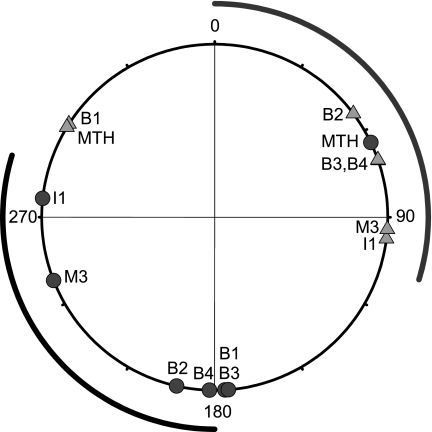
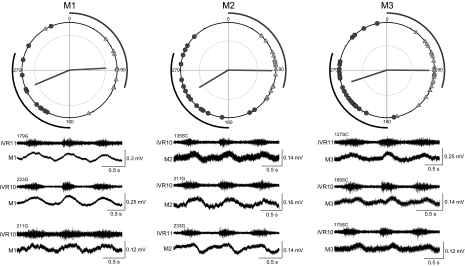
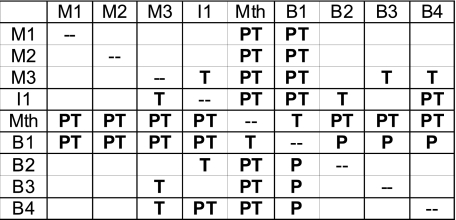
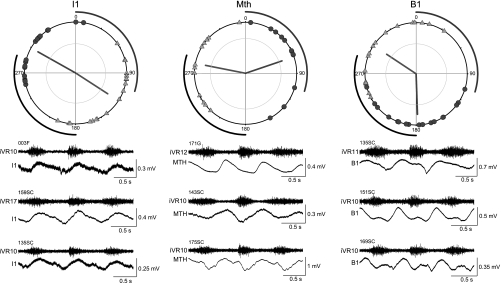
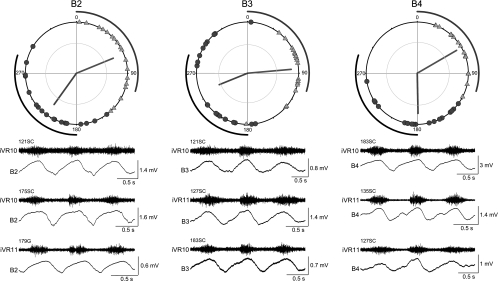
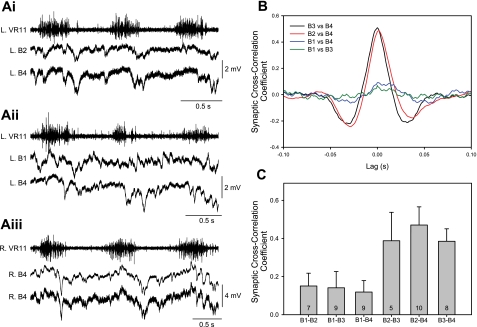
Locomotor feedback signals from the spinal cord to descending brain stem neurons were examined in the lamprey using the uniquely identifiable reticulospinal neurons, the Müller and Mauthner cells. The same identified reticulospinal neurons were recorded in several preparations, under reduced conditions, to address whether an identified reticulospinal neuron shows similar locomotor-related oscillation timing from animal to animal and whether these timing signals can differ significantly from other identified reticulospinal neurons. Intracellular recordings of membrane potential in identified neurons were made in an isolated brain stem-spinal cord preparation with a high-divalent cation solution on the brain stem to suppress indirect neural pathways and with D-glutamate perfusion to the spinal cord to induce fictive swimming. Under these conditions, the identified reticulospinal neurons show significant clustering of the timings of the peaks and troughs of their locomotor-related oscillations. Whereas most identified neurons oscillated in phase with locomotor bursting in ipsilateral ventral roots of the rostral spinal cord, the B1 Müller cell, which has an ipsilateral descending axon, and the Mauthner cell, which has a contralateral descending axon, both had oscillation peaks that were out of phase with the ipsilateral ventral roots. The differences in oscillation timing appear to be due to differences in synaptic input sources as shown by cross-correlations of fast synaptic activity in pairs of Müller cells. Since the main source of the locomotor input under these experimental conditions is ascending neurons in the spinal cord, these experiments suggest that individual reticulospinal neurons can receive locomotor signals from different subsets of these ascending neurons. This result may indicate that the locomotor feedback signals from the spinal locomotor networks are matched in some way to the motor output functions of the individual reticulospinal neurons, which include command signals for turning and for compensatory movements.


Figures

Fig. 1.
Fig. 1.
Locations of the uniquely identifiable Müller and Mauthner cells. A: photomicrograph of the dorsal surface of the isolated lamprey (Petromyzon marinus) brain and about 2 segments of spinal cord. This brain preparation retains some meningeal sheath that is speckled with numerous dark melanocytes. The dashed rectangle indicates the region shown in B. M, mesencephalon; R, rhombencephalon; SC, spinal cord. B: fluorescent photomicrograph of Müller and Mauthner cells injected intracellularly with Lucifer yellow. In this image, not all the cells injected were Müller cells and not all Müller cells were successfully injected. The Müller cells not injected were the right I1, right B2, and right B4. The I cell at right is I2, as is the smaller I cell at left, and the large I cell at left is I1. The I2 cells were not used in this study. Two smaller reticulospinal neurons just caudal to the uninjected right B4 were also injected. C: schematic of the typical arrangement of the Müller and Mauthner cells used in this study. The dashed line represents the midline. M1–M3, mesencephalic Müller cells located in the mesencephalic reticular nucleus; I1, isthmic Müller cells located in the anterior reticular nucleus; B1–B4, bulbar Müller cells located in the middle rhombencephalic reticular nucleus; MTH, Mauthner cells.
Fig. 2.
Fig. 2.
Experimental configuration and data analysis methods. A: brain stem and spinal cord preparation. Although not illustrated, the brain and spinal cord remain attached to the underlying brain case and notochord, respectively. The brain was transected at the rostral border of the mesencephalon as indicated by the dashed line to create a brain stem-spinal cord preparation. The spinal cord extended to the beginning of the dorsal midline fin (to about segment 40 of 100), and a movable surface electrode on the spinal cord near the end was used to record the spikes of reticulospinal axons to determine their laterality and conduction velocity. The laterality of the axons could be determined by moving the suction electrode from one side of the cord to the other and comparing the amplitude of the spikes in an individual axon. Ventral roots on both sides of the spinal cord were recorded at or near segment 10. A petroleum jelly diffusion barrier was constructed at segments 2–4. d-Glutamate (0.7 mM) was added to the spinal cord bath perfusion fluid, and a high-divalent cation solution (20 mM Ca2+, 5.8 mM Mg2+) was added to brain stem bath perfusion. A sharp intracellular microelectrode was used to systematically record the membrane potentials of Müller and Mauthner cells. B: a sample of data recorded from the 2 ventral root electrodes and the intracellular electrode in the reticulospinal Müller cell B4. The onsets of the ventral root bursts ipsilateral to the intracellular somatic recording were marked and used as the trigger signal for the creation of trace averages. C: the averaged ipsilateral ventral root bursts and the averaged intracellular recording of the reticulospinal neuron. The timings of the peak and the trough of the averaged oscillation in relation to the onset of the ipsilateral ventral root burst were measured, normalized to cycle period, and expressed as phase angles in degrees. D: the phase angles of the peaks (triangles) and troughs (circles) of the same uniquely identified Müller or Mauthner cells recorded in multiple preparations are plotted on a circle. For this circular plot, time progresses clockwise, beginning at the top of the circle at 0°, which is defined as the beginning of the ipsilateral ventral root burst. A typical ipsilateral ventral root burst onset and offset are shown outside the circle as a gray arc; a typical contralateral ventral root burst is shown as a black arc beginning at 180°. The angle of the light gray vector indicates the mean phase angle of the oscillation peaks; the angle of the dark gray vector indicates the mean phase angle of the oscillation troughs. The length of each vector is its r value, i.e., the concentration of the individual angles. The gray inner circle is P = 0.001 of the Rayleigh z value, and it indicates the length of the vector (r) needed to provide P = 0.001 probability that the data points are not randomly distributed around the circle. RS, reticulospinal neuron; LVR10 and RVR10, ventral root recording at spinal segment number 10 on the left and right sides, respectively; RB4, B4 Müller cell on the right side.
Fig. 3.
Fig. 3.
Examples of averaged waveforms of locomotor oscillations observed in a single Müller cell (B3) in 3 different preparations (labeled with identifying preparation numbers). A: the oscillations could be simple with a single peak and trough, with or without an inflection. B: in some cases, there could be double peaks and troughs, usually with 1 peak being much smaller than the other. C: in rare cases, the double peaks were of similar size. D: a plot of the phase difference between the double peaks reveals that the 2 peaks tend to occur at about one-half swim cycle apart (173°). For this plot, the time between the 2 peaks was measured in trace averages, normalized to cycle period, and expressed as degrees. These data comprise 47 cells with double peaks from 17 preparations. iVR, ipsilateral ventral root recording at the spinal segment number indicated.
Fig. 4.
Fig. 4.
Mean peak-to-trough amplitudes of the locomotor oscillations in the Müller and Mauthner cells. Generally, the closer the cell's location to the spinal cord, the larger the amplitudes. Bar height is the mean oscillation amplitude of the population, and the error bar is +SD. The B2–B4 amplitudes are significantly larger than M1–M3 amplitudes (P < 0.05, Kruskal-Wallis 1-way ANOVA, Dunn's test for multiple comparisons). The number of cells in each group is indicated by the number in or above each bar.
Fig. 5.
Fig. 5.
Test of the pharmacology of the locomotor oscillations in Müller cells. A: raw traces illustrate a B4 neuron exposed first to kynurenic acid in the brain stem bathing solution (A2), producing a reduction in the maximum amplitude of the depolarizing phase of the oscillations with little effect on the maximum level of the trough compared with control (A1). Strychnine was added after the effects of kynurenic acid had reached a steady state (A3), resulting in a further decrease in oscillation amplitude by reducing the maximum level of the troughs. The calibration bars at right indicate the membrane potential. B: summary of blocker effects. Kynurenic acid (2 mM; B1) and strychnine (5 μM; B2) significantly reduced oscillation amplitude (*P < 0.05 vs. control, paired t-test). The experiments were done on a mixture of all of the B Müller cells. Strychnine was often (n = 6), but not always (n = 2), applied in the presence of kynurenic acid. Control is the amplitude of oscillations just before the drug is introduced. Osc. Amp., oscillation amplitude.
Fig. 6.
Fig. 6.
Examples of peak and trough timings of several identified Müller and Mauthner cells recorded in the same preparation (127SC). Some of the cells showed different timings of the peak and trough of their averaged locomotor oscillation from the spinal cord, suggesting that some of the individual cells are receiving different ascending inputs.
Fig. 7.
Fig. 7.
Summary of oscillation timings in M1, M2, and M3 Müller cells. Top: circular plots showing the phase angles of the peak (triangles) and trough (circles) for each of the cells recorded. The vectors in the circular plots give the mean phase angle for the peaks (light gray) and the troughs (dark gray). The length of the vector is r, a measure of the concentration of the phase angles. The inner circle indicates the r value required to reject the hypothesis that the angles are randomly distributed on the circle (P = 0.001). Bottom: 3 representative traces for each of the Müller cells, recorded in different preparations (identifying preparation number given for each trace). Number of cells in each plot: M1 = 11; M2 = 17; M3 = 24.
Fig. 8.
Fig. 8.
Summary of significant differences in the oscillation timings between the recorded populations of each Müller and Mauthner cell using a nonparametric test of circular statistics (Wheeler and Watson test) between pairs of populations. In this matrix, a significant difference in the timing of the peaks (P), troughs (T), or both (PT) is indicated by the presence the corresponding letter (P < 0.001).
Fig. 9.
Fig. 9.
Summary of the oscillation timings in I1, Mauthner, and B1 cells. These 3 cells have differences in the timings of their peaks and troughs compared with other cells. For example, the means of the peak phase angles of B1 Müller cell and the Mauthner cell differ from the peaks of all other cells, because they tend to occur near the end of the contralateral ventral root burst instead of during the ipsilateral ventral root burst as in most cells. Number of cells in each plot: I1 = 19; Mauthner = 13; B1 = 18.
Fig. 10.
Fig. 10.
Summary of the oscillation timings in B2, B3, and B4 cells. These Müller cells tend to have larger amplitude oscillations than the other Müller cells and the Mauthner cells. The mean phase angles of the peaks and troughs are not significantly different from one another but do have significant differences with other cells. Number of cells in each plot: B2 = 18; B3 = 20; B4 = 17.
Fig. 11.
Fig. 11.
Cross-correlations of fast synaptic activity between pairs of B cells. A: examples of raw traces from simultaneous intracellular recordings of pairs of ipsilateral B cells in 1 preparation (233G): i, paired recording of B2 and B4 on the same side (peak cross-correlation coefficient = 0.50); ii, paired recording of B1 and B4 on the same side (peak cross-correlation coefficient = 0.08); iii, dual impalement of B4 (peak cross-correlation coefficient = 0.92). B: examples of the cross-correlations in another preparation (135SC) showing that B1 vs. B3 or B4 had low correlation coefficients, whereas B4 vs. B3 or B2 had higher correlation coefficients. C: this same pattern was observed in several preparations, and the means (+SD) are summarized in the bars. The fast synaptic activity of B1 had low correlation when paired with B2, B3, or B4, whereas pairs among B2, B3, and B4 had significantly higher correlations than pairs involving B1 (P < 0.05, t-test). The number in each bar indicates the number of paired recordings performed.

Similar articles

Cited by

References

    1. Antri M, Fénelon K, Dubuc R. The contribution of synaptic inputs to sustained depolarizations in reticulospinal neurons. J Neurosci 29: 1140–1151, 2009 - PMC - PubMed
    1. Arshavsky YI, Berkinblit MB, Fukson OI, Gelfand IM, Orlovsky GN. Recordings of neurons of the dorsal spinocerebellar tract during evoked locomotion. Brain Res 43: 272–275, 1972 - PubMed
    1. Arshavsky YI, Gelfand IM, Orlovsky GN, Pavlova GA. Messages conveyed by spinocerebellar pathways during scratching in the cat. I. Activity of neurons of the lateral reticular nucleus. Brain Res 151: 479–491, 1978a - PubMed
    1. Arshavsky YI, Gelfand IM, Orlovsky GN, Pavlova GA. Messages conveyed by spinocerebellar pathways during scratching in the cat. II. Activity of neurons of the ventral spinocerebellar tract. Brain Res 151:493–506, 1978b - PubMed
    1. Berry MS, Pentreath VW. Criteria for distinguishing between monosynaptic and polysynaptic transmission. Brain Res 105: 1–20, 1976 - PubMed

Publication types

LinkOut - more resources