. 2011 Sep 30;286(39):33954-62.
doi: 10.1074/jbc.M110.187344. Epub 2011 Aug 10.

Prostaglandin E2 regulates renal cell carcinoma invasion through the EP4 receptor-Rap GTPase signal transduction pathway

Affiliations

Prostaglandin E2 regulates renal cell carcinoma invasion through the EP4 receptor-Rap GTPase signal transduction pathway

Juanjuan Wu et al. J Biol Chem. .

Abstract

Prognosis for patients with early stage kidney cancer has improved, but the treatment options for patients with locally advanced disease and metastasis remain few. Understanding the molecular mechanisms that regulate invasion and metastasis is critical for developing successful therapies to treat these patients. Proinflammatory prostaglandin E(2) plays an important role in cancer initiation and progression via activation of cognate EP receptors that belong to the superfamily of G protein-coupled receptors. Here we report that prostaglandin E(2) promotes renal cancer cell invasion through a signal transduction pathway that encompasses EP4 and small GTPase Rap. Inactivation of Rap signaling with Rap1GAP, like inhibition of EP4 signaling with ligand antagonist or knockdown with shRNA, reduces the kidney cancer cell invasion. Human kidney cells evidence increased EP4 and decreased Rap1GAP expression levels in the malignant compared with benign samples. These results support the idea that targeted inhibition of EP4 signaling and restoration of Rap1GAP expression constitute a new strategy to control kidney cancer progression.


Figures
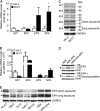
FIGURE 1.
FIGURE 1.
Expression of EPs in kidney cancer cells. A and B, expression of PTGER genes in HK-2 and RCC7 cells. Isolated RNA was reverse transcribed and equal amounts of cDNA was subjected to real-time PCR amplification to establish relative expression of the PTGER1 (EP1), PTGER2 (EP2), PTGER3 (EP3), or PTGER4 (EP4) genes. The gene expression was calculated as described, and the data were expressed as RNA levels in RCC7 relative to HK-2 cells (A) and EP relative to GAPDH in RCC7 and HK-2 cells (B). Each point represents the mean ± S.E. of values obtained from three experiments each performed in triplicate. *, p < 0.05 versus corresponding HK-2 samples. C, expression of the EP4 protein is increased in RCC7 compared with HK-2 cells. Equal amounts of cell lysates were analyzed by immunoblotting using specific anti-EP1, -EP2, -EP3, -EP4, or -GAPDH antibodies. GAPDH was used to calibrate total protein loading. D, EP4 antibody blocking peptides decrease the intensity of the detected EP4 protein band. Two sets of equal amounts of cell lysate from HEK, HEK-EP4, and HEK + HA-EP4 were fractionated on SDS-PAGE and transferred to filters. After blocking, one filter was incubated with anti-EP4 antibodies alone and the other with anti-EP4 antibodies that were pre-mixed with blocking peptides. The filters were analyzed by immunoblotting to detect EP4 and Actin (used as loading control) proteins. HEK-EP4, HEK293 cells stably overexpressing EP4; HEK + HA-EP4, HEK293 cells transiently transfected with HA-EP4 cDNA. Arrows on left indicate EP4 protein. E, expression of EP4 protein in kidney cancer cell lines. Equal amounts of cell lysates were analyzed by immunoblotting to detect EP4 and GAPDH (used as loading control) proteins. Arrows on left indicate EP4 protein. For C and E, contemporaneous short and long exposures of the same filter are shown to provide visual evidence for the relative expression of the EP4 protein.
FIGURE 2.
FIGURE 2.
EP4 mediates the PGE2-induced RCC7 cell invasion. A, effect of PGE2 on RCC7 cell proliferation. Cells were stimulated with PGE2 (or 10% FBS used as a control) for 2 days at 37 °C, harvested, and incubated with 0.1% trypan blue stain. Cells excluding the dye were counted under light microscopy with hemocytometer. Each point represents the mean ± S.E. of values obtained from four experiments. *, p < 0.05 versus non-stimulated (NS) samples. B, PGE2 promotes RCC7 cell invasion. Equal number of RCC7 or HK-2 cells were starved overnight and allowed to invade collagen-coated transwell filters in the presence or absence of PGE2 (in nm). Cells that migrated to the bottom of the filter were stained with crystal violet and five fields were randomly selected and counted using a phase-contrast microscope. Each point represents the mean ± S.E. of values obtained from five experiments. *, p < 0.05 versus not stimulated (NS) samples. C, effect of EP4 antagonists AH23848 and GW627368 on RCC7 cell invasion. Invasion assays were done using cells pre-treated for 10 min, or not, with AH23848 (5 μm) or GW627368 (1 μm) and stimulated with PGE2 (5 nm). Data represent the fold-increase relative to nonstimulated values and *, p < 0.05. D, knockdown of endogenous EP4 expression attenuates the PGE2-induced RCC7 invasion. Cells stably expressing shGFP (control) or shEP4 were treated as in B. Five fields were randomly selected and counted and each point represents the mean ± S.E. of values obtained from three experiments. *, p < 0.05 versus corresponding nonstimulated samples. E, effect of PGE2 (5 nm) on the invasion of Caki-1 cells. Cells were treated and analyzed exactly as in B. *, p < 0.05 versus corresponding NS samples.
FIGURE 3.
FIGURE 3.
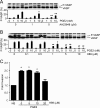
Role of PKA in the PGE2-induced RCC7 cell invasion. A, effect of AH23848 on VASP phosphorylation. RCC7 cells were pretreated, or not, for 10 min with AH23848 (1 μm, 5 μm) and stimulated with PGE2 (in nm) for 5 min. Cell monolayers were lysed and subjected to Western blot analysis using anti-VASP antibodies. Note that the phosphorylation of VASP retards its migration on SDS-PAGE. Data are expressed as the intensity ratio of phosphorylated (upper band) to total (upper and lower bands) VASP protein. Values shown represent mean ± S.E. from three separate experiments. *, p < 0.05 and **, p < 0.01 versus PGE2-treated, but AH23848-untreated samples. B, PKA phosphorylates VASP. RCC7 cells were treated, or not, for 30 min with the PKA inhibitor H89 (0.1 μm to 10 μm) and stimulated with PGE2 (in nm) for 5 min. Cells were analyzed for VASP phosphorylation by immunoblotting with anti-VASP antibodies. Data are expressed as the intensity ratio of phosphorylated (upper band) to total (upper and lower bands) VASP protein. Values shown represent mean ± S.E. from three separate experiments. *, p < 0.05 and **, p < 0.01 versus PGE2-treated, but H89-untreated samples. C, treatment with H89 does not impact the PGE2-induced RCC7 cell invasion. H89 (5–20 μm) was added, or not, to the top and bottom compartments and cells were allowed to invade collagen-coated transwell filters in response to PGE2 (5 nm) stimulation. Each point represents the fold-increase relative to the vehicle alone sample and *, p < 0.05 versus not stimulated (NS) samples.
FIGURE 4.
FIGURE 4.
PGE2 promotes the Rap activation in RCC7 cells. A, PGE2 induces the EP4-dependent conformational change in Epac1. A representative time course of the YFP:CFP emission ratio in RCC7 cells expressing the cAMP biosensor CFP-Epac1-YFP. Cells were treated with PGE2 (10 nm) alone or together with AH23848 (5 μm), as described. B and C, PGE2 activates Rap. RCC7 cells were treated, or not, with AH23848 (5 μm) for 10 min, then with PGE2 (in nm) for an additional 5 min. Cell lysates were subjected to pulldown assays using GST fusion of the RBD domain of RalGDS protein. Levels of activated Rap1 (Rap1·GTP) and total Rap1 proteins were determined by immunoblotting using anti-Rap1 antibodies. Representative blots are shown in B and data summary are shown in C. Data are presented as fold-increase of basal Rap1·GTP, where the basal amount of Rap1·GTP in untreated cells is assigned a value of 1.0. Data shown represent the mean ± S.E. values from five separate experiments. *, p < 0.05 versus non-stimulated control values. D, knockdown of Epac abrogates the PGE2-induced Rap1·GTP accumulation. RCC7 cells transiently transfected with scrambled siRNA (siCon) or siRNA targeting Epca1 and -2 genes (siEpac) were subjected to Rap1·GTP pulldown assay after treatment with PGE2 (5 nm) for 5 min, as described in B. Data represent the fold-increase relative to nonstimulated (NS) values and *, p < 0.05.
FIGURE 5.
FIGURE 5.
Expression of Rap1GAP in human cancer cells. A, schematic presentation of the Rap1GAP protein structure. The GAP domain was cloned as a fusion protein with hemagglutinin (HA) tag. Lysine residues 194 and 285 and asparagine residue 290 were changed to alanine by site-directed mutagenesis. Gz, binding domain to Gαz. B, Rap activation is inhibited by the forced overexpression of wild-type GAP domain of Rap1GAP. RCC7 cells stably expressing GAP domain (wild-type, K194A, K285A, or N290A) of Rap1GAP were stimulated with PGE2 (5 nm), lysed, and mixed with agarose beads conjugated to GST-RalGDS-RBD to capture the Rap1·GTP. Precipitated proteins were analyzed by immunoblotting using anti-Rap1 antibodies. Data are presented as fold-increase of basal Rap1·GTP, where the basal amount of Rap1·GTP in untreated cells is assigned a value of 1.0. Data shown represent the mean ± S.E. values from three separate experiments. *, p < 0.05 versus nonstimulated (NS) control values. WT, wild type RCC7 cells; EV, RCC7 cells stably expressing empty vector. C, expression of Rap1GAP protein in human kidney cancer cell lines. Cell lysates were obtained from the NCI and analyzed by Western blotting for expression of Rap1GAP (upper panel) and GAPDH (lower panel) proteins.
FIGURE 6.
FIGURE 6.
Rap mediates the PGE2-induced RCC7 cell invasion. A, role of Rap signaling in RCC7 cell proliferation. Cells stably expressing wild-type or mutated GAP domains of Rap1GAP were grown in starvation medium, or in medium containing 10% fetal bovine serum. The cells were cultured for 3 days, harvested, and stained with trypan blue. The cells excluding the dye were counted under light microscopy with a hemocytometer. Each point represents the mean ± S.E. of values obtained from three experiments. *, p < 0.05 versus same cell type in starvation medium. NS, non-stimulated; WT, control wild-type RCC7 cells; EV, RCC7 cells transfected with empty vector. B, PGE2 induces the Rap-mediated RCC7 cell invasion. RCC7 cells stably expressing the GAP domain (wild-type, K194A, K285A, or N290A) of Rap1GAP were allowed to invade collagen-coated transwell filters in response to stimulation with PGE2 (5 nm). Cells that migrated to the bottom side of the filter were stained and inspected using a phase-contrast microscope. Cells in randomly selected five fields were counted and each experiment was repeated three times. *, p < 0.05 versus not stimulated (NS) samples. WT, wild-type RCC7 cells; EV, RCC7 cells stably expressing empty vector.
FIGURE 7.
FIGURE 7.
Rap mediates the cell adhesion. A, schematic presentation of the signal relay from activated EP4 to Rap and cell invasion. AA, arachidonic acid; AC, adenylyl cyclase. B, effect of Rap activity on cell adhesion. RCC7 cells stably expressing empty vector (EV) or the GAP domain (GAP-WT) of Rap1GAP were suspended in starvation medium supplemented, or not, with PGE2 or FBS. Adherent cells were stained with crystal violet and dye absorbance was measured at a wavelength of 570 nm. Data are presented as fold-increase above basal, where the basal absorbance in untreated cells is assigned a value of 1.0. Data shown represent the mean ± S.E. from three separate experiments. *, p < 0.05 versus nonstimulated (NS) control values. EV and GAP-WT denote, respectively, RCC7 cells stably expressing empty vector and GAP domain of Rap1GAP. C, effect of PGE2 on E-cadherin expression. RCC7 cells were treated, or not, with PGE2 for 24 h and lysates were analyzed by Western blotting for expression of E-cadherin (upper panel) and GAPDH (lower panel) proteins.

Similar articles

Cited by

References

    1. Jemal A., Siegel R., Ward E., Hao Y., Xu J., Thun M. J. (2009) CA Cancer J. Clin. 59, 225–249 - PubMed
    1. Biswas S., Eisen T. (2009) Nat. Rev. Clin. Oncol. 6, 478–487 - PubMed
    1. Young A. N., Dale J., Yin-Goen Q., Harris W. B., Petros J. A., Datta M. W., Wang M. D., Marshall F. F., Amin M. B. (2006) Urology 67, 873–880 - PubMed
    1. Schlesinger-Raab A., Treiber U., Zaak D., Hölzel D., Engel J. (2008) Eur. J. Cancer 44, 2485–2495 - PubMed
    1. Murai M., Oya M. (2004) Curr. Opin. Urol. 14, 229–233 - PubMed

Publication types

MeSH terms