. 2011 Sep 30;286(39):34199-214.
doi: 10.1074/jbc.M111.247684. Epub 2011 Aug 10.

The extracellular signal-regulated kinase mitogen-activated protein kinase/ribosomal S6 protein kinase 1 cascade phosphorylates cAMP response element-binding protein to induce MUC5B gene expression via D-prostanoid receptor signaling

Affiliations

The extracellular signal-regulated kinase mitogen-activated protein kinase/ribosomal S6 protein kinase 1 cascade phosphorylates cAMP response element-binding protein to induce MUC5B gene expression via D-prostanoid receptor signaling

Yeon Ho Choi et al. J Biol Chem. .

Abstract

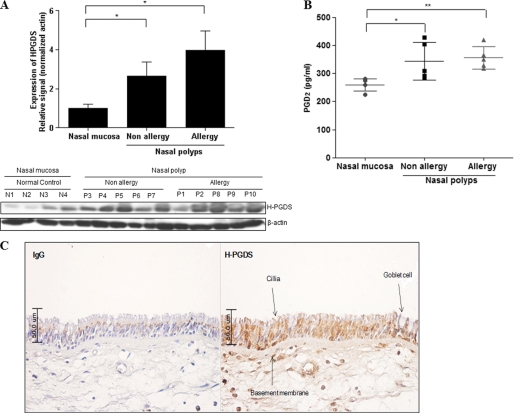
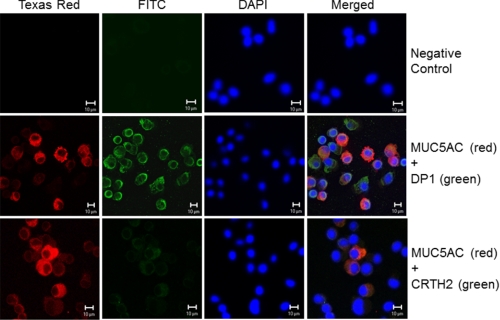
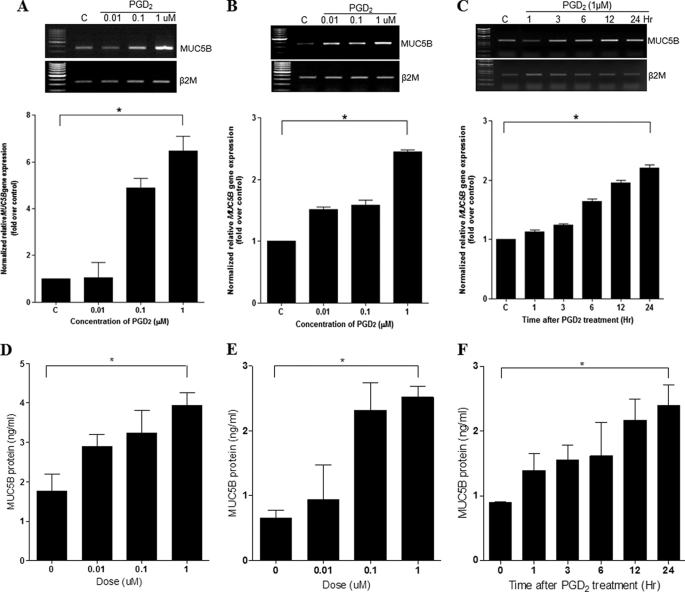
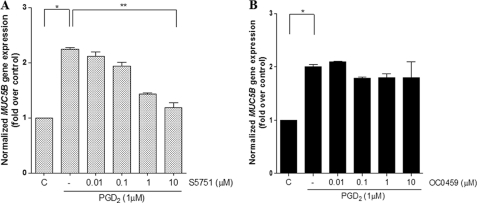
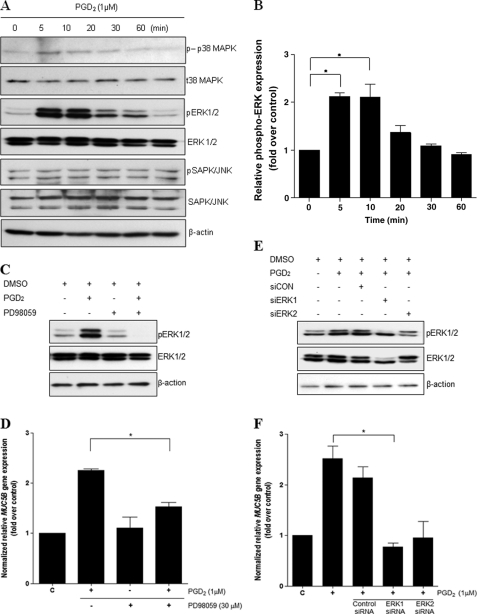
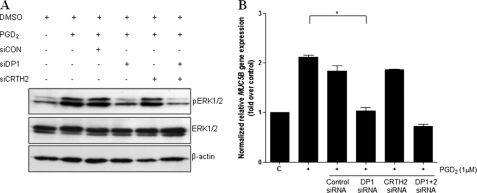
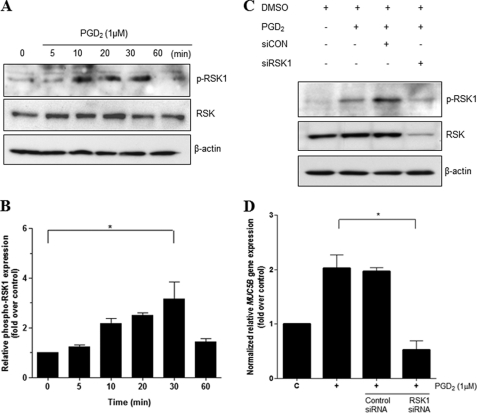
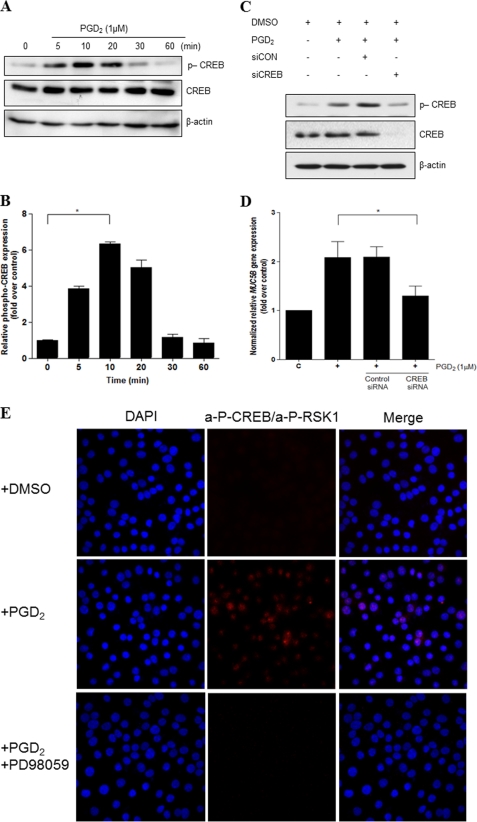
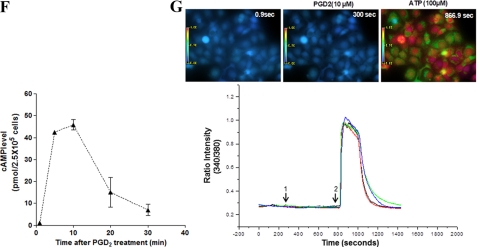
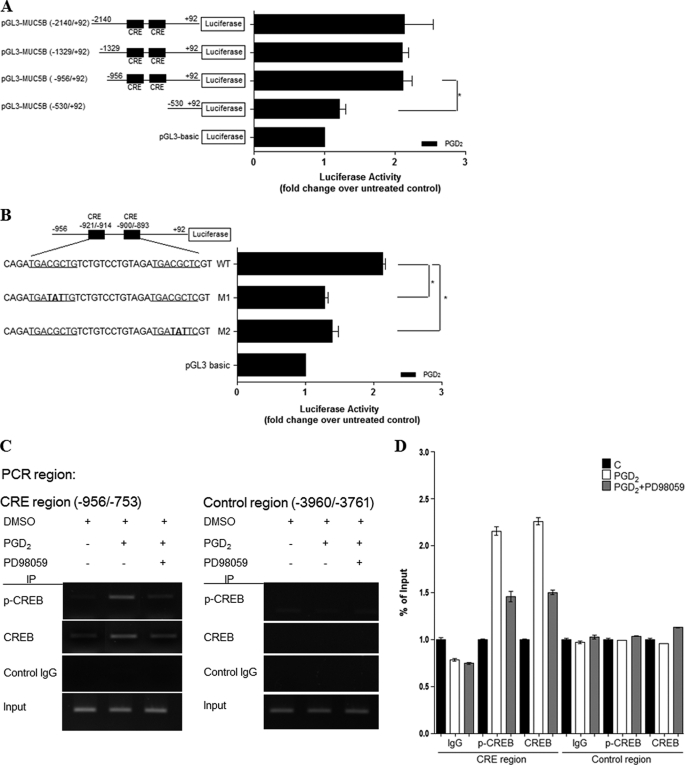
Mucus hypersecretion is a prominent feature of respiratory diseases, and MUC5B is a major airway mucin. Mucin gene expression can be affected by inflammatory mediators, including prostaglandin (PG) D(2,) an inflammatory mediator synthesized by hematopoietic PGD synthase (H-PGDS). PGD(2) binds to either D-prostanoid receptor (DP1) or chemoattractant receptor homologous molecule expressed on T-helper type 2 cells (CRTH2). We investigated the mechanisms by which PGD(2) induces MUC5B gene expression in airway epithelial cells. Western blot analysis showed that H-PGDS was highly expressed in nasal polyps. Similar results were obtained for PGD(2) expression. In addition, we could clearly detect the expressions of both H-PGDS and DP1 in nasal epithelial cells but not CRTH2. We demonstrated that PGD(2) increased MUC5B gene expression in normal human nasal epithelial cells as well as in NCI-H292 cells in vitro. S5751, a DP1 antagonist, inhibited PGD(2)-induced MUC5B expression, whereas a CRTH2 antagonist (OC0459) did not. These data suggest that PGD(2) induced MUC5B expression via DP1. Pretreatment with extracellular signal-regulated kinase (ERK) inhibitor (PD98059) blocked both PGD(2)-induced ERK mitogen-activated protein kinase (MAPK) activation and MUC5B expression. Proximity ligation assays showed direct interaction between RSK1 and cAMP response element-binding protein (CREB). Stimulation with PGD(2) caused an increase in intracellular cAMP levels, whereas intracellular Ca(2+) did not have such an effect. PGD(2)-induced MUC5B mRNA levels were regulated by CREB via direct interaction with two cAMP-response element sites (-921/-914 and -900/-893). Finally, we demonstrated that PGD(2) can induce MUC5B overproduction via ERK MAPK/RSK1/CREB signaling and that DP1 receptor may have suppressive effects in controlling MUC5B overproduction in the airway.


Figures

FIGURE 1.
FIGURE 1.
H-PGDS protein and PGD2 are expressed in human nasal polyps. A, the expression of H-PGDS in homogenates of tissue specimens from 4 healthy subjects and 10 subjects with human nasal polyps is shown. Total cell lysates were prepared for Western blot analysis. Values above the figures represent the relative density of the bands normalized to β-actin. Results are representative of three independent experiments. Data are expressed as the mean ± S.D. *, p < 0.05 according to Wilcoxon's rank sum test for control versus non-allergic group and control versus allergic group. B, we measured the PGD2 level in human nasal polyps using a PGD2-MOX ELISA kit. PGD2 levels were standardized according to the concentration of total protein for each sample. Each bar represents the median concentration of PGD2. Significance was determined by the Mann-Whitney U test. The results are expressed as pg/mg of protein and are the mean ± S.D. of 4 healthy subjects and 10 subjects with nasal polyps. *, p < 0.05 versus healthy subjects. **, p < 0.05 versus healthy subjects. C, strong H-PGDS immune-reactivity is observed in human primary nasal epithelial cells. The negative control (IgG; without H-PGDS antibody) shows no immunoreactivity (200×).
FIGURE 2.
FIGURE 2.
PGD2 receptors are expressed in human primary nasal epithelial cells. Cellular localization of PGD2 receptors (DP1 and CRTH2) and MUC5AC proteins in human nasal epithelial cells was analyzed using double-immunocytofluorescence staining with antibodies against MUC5AC and PGD2 receptors (DP1 and CRTH2). Immunostaining of MUC5AC (red) and DP1 (green) is shown. Merged images show co-localization of MUC5AC and DP1 in yellow (middle panels). Immunostaining of MUC5AC (red) and CRTH2 (green) is shown. Overlays of the images show co-localization of MUC5AC and CRTH2 in yellow (lower panels). No staining was detected when both primary antibodies were omitted (upper panels) (Bars indicate 10 μm).
FIGURE 3.
FIGURE 3.
PGD2 induces MUC5B expression in NHNE and human lung mucoepidermoid carcinoma (NCI-H292) cells. A, NHNE cells were pretreated apically and basolaterally with PGD2 at the indicated concentrations for 24 h. Cell lysates were harvested for real-time quantitative RT-PCR. B, NCI-H292 cells were treated with PGD2 (0.01, 0.1, and 1 μm) for 24 h. Cell lysates were harvested for real-time quantitative RT-PCR. C, cells were treated with PGD2 (1 μm) for 1, 3, 6, 12, and 24 h, and total RNA were isolated. MUC5B expression relative to that of β2M was determined using real-time quantitative RT-PCR. D, we measured MUC5B levels in NHNE using a MUC5B ELISA kit. MUC5B levels were standardized according to the concentration of total protein for each sample. NHNE cells were pretreated apically and basolaterally with PGD2 at the indicated concentrations for 24 h. E, NCI-H292 cells were treated with PGD2 (0.01, 0.1, and 1 μm) for 24 h. Cell lysates were harvested for ELISA. F, NCI-H292 cells were treated with PGD2 (1 μm) for 1, 3, 6, 12, and 24 h. The mean values of MUC5B estimated by ELISA in cell lysates and its subgroups are expressed as ng of standard reactivity/ml of diluted resolubilized mucin sample. Significance was determined by the Mann-Whitney U test. Data are expressed as the mean ± S.D. of triplicate cultures. At least three separate experiments were performed for each measurement. C, untreated control; *, p < 0.05 versus untreated control.
FIGURE 4.
FIGURE 4.
DP1 is required for PGD2-induced MUC5B gene expression in NCI-H292 cells. A, cells were treated with S5751 (DP1 antagonist, final concentration 0.01–10 μm) for 1 h before stimulation with 1 μm PGD2. B, cells were treated with OC0459 (CRTH2 antagonist, final concentration 0.01–10 μm) for 1 h before stimulation with 1 μm PGD2. Cells were subsequently stimulated with 1 μm PGD2 for 24 h. MUC5B expression relative to that of β2M was determined using real-time quantitative RT-PCR. Values represent the mean ± S.D. The results represent three independent experiments. C, untreated control; *, p < 0.05 versus untreated control; **, p < 0.001 versus PGD2 treatment alone.
FIGURE 5.
FIGURE 5.
PGD2 induces MUC5B gene expression via ERK MAPK signaling. A, confluent cells were treated with PGD2 (1 μm) for 5, 10, 20, 30, and 60 min, and cell lysates were harvested for Western blot analysis. B, quantitation of the p-ERK/ERK ratio is shown. Representative Western blots using phospho-specific antibodies show transient activation of ERK1/2, with a maximum effect at 5 min. ERK1/2, total ERK1/2. C, cells were pretreated for 1 h with PD98059 (30 μm) and stimulated for 5 min with PGD2 (1 μm) before collection of cell lysates for Western blot analysis. D, confluent cells were pretreated for 1 h with PD98059 (30 μm) and stimulated for 24 h with PGD2 (1 μm) before collection of total RNA for real-time quantitative RT-PCR. E, after transfection with siERK1 (40 nm), siERK2 (40 nm), or siRNA-negative control (40 nm), cells were stimulated with PGD2 (1 μm) for 5 min followed by analysis of proteins using Western blotting. F, transfected cells were stimulated with PGD2 (1 μm) for 24 h before the collection of total RNA for real-time quantitative RT-PCR. MUC5B expression relative to that of β2M was determined using real-time quantitative PCR. The figures are representative of at least three independent experiments. Data are expressed as the mean ± S.D. C, untreated control; *, p < 0.05 versus PGD2 treatment alone.
FIGURE 6.
FIGURE 6.
DP1 is essential for PGD2-induced MUC5B expression through ERK signaling in NCI-H292 cells. A, cells were transiently transfected with constructs expressing siRNA for DP1, CRTH2, DP1 + DP2, or control siRNA. Cells were serum-starved and treated with 1 μm PGD2 for 5 min, after which cell lysates were harvested for Western blot analysis with anti-ERK1/2. B, cells were serum-starved and treated with 1 μm PGD2 for 24 h, after which cell lysates were harvested for real-time quantitative RT-PCR. MUC5B expression was determined relative to that of β2M using real-time quantitative PCR. C, untreated control; *, p < 0.05 versus PGD2 treatment alone.
FIGURE 7.
FIGURE 7.
RSK1 is essential for PGD2-induced MUC5B gene expression. A, confluent and quiescent cells were stimulated with PGD2 (1 μm) in a time-dependent manner for up to 1 h followed by harvesting of cell lysates and Western blot analysis using anti-phospho-RSK1. β-Actin served as an internal control. B, quantitation of the p-ERK/ERK ratio is shown. The results of Western blot analyses are representative of three separate experiments. C, cells were transiently transfected with RSK1 siRNA constructs. Transfected cells were serum-starved overnight before treatment with PGD2 (1 μm) for 30 min, after which cell lysates were harvested for Western blot analysis using specific antibodies. D, 24 h after transfection, cells were treated with PGD2 (1 μm) and harvested for real time quantitative RT-PCR. MUC5B expression was determined relative to β2M by real-time quantitative PCR. Figures represent three independent experiments. Data are expressed as mean ± S.D. C, untreated control; *, p < 0.05 versus PGD2 treatment alone.
FIGURE 8.
FIGURE 8.
CREB mediates PGD2-induced MUC5B gene expression independent of Ca2+ signaling. A, confluent and quiescent cells were treated with PGD2 (1 μm) for 5, 10, 20, 30, and 60 min, and cell lysates were processed for Western blot analysis using phospho-specific antibodies. β-Actin was used as an internal control. B, quantitation of the p-CREB/CREB ratio is shown. The results of Western blot analyses are representative of three separate experiments. C, cells were transfected with siCREB (40 nm) or siRNA-negative control (40 nm) and stimulated with PGD2 (1 μm) for 10 min before Western blot analysis. D, cells were serum-starved overnight, stimulated with PGD2 (1 μm) for 24 h, and analyzed using real time quantitative RT-PCR. MUC5B expression was determined relative to that of β2M using real-time quantitative PCR. The figures are representative of three independent experiments. Data are expressed as the mean ± S.D. C, untreated control; *, p < 0.05 versus PGD2 treatment alone. E, fluorescence images are shown to indicate interaction between two proteins. Staining with primary anti-CREB goat polyclonal and anti-RSK1 rabbit polyclonal antibodies was followed by species-specific secondary antibodies with PLA probes. PLA signaling (red dots) was detected in NCI-H292 cells using confocal microscopy (60×). F, cells were serum-starved overnight and then treated with the indicated concentrations of PGD2 for 1 h, after which cAMP production was measured. The values shown are the means ± S.D. of experiments performed in triplicate. G, shown are fluorescence changes in response to PGD2 in NCI-H292 cells (10 μm). PGD2 in DMSO was added to Fluo-2/AM-labeled cells (arrow 1), and ATP (100 μm) was added after 8 min (arrow 2). The mean basal level of [Ca2+]i was measured for 1 min before any treatment. Blue areas represent basal [Ca2+]i, and green and red areas represent an increase from base line. [Ca2+]i versus time is shown for 10 cells (left). Colored lines show the trace of [Ca2+]i mobilization in individual cells (right). Results are representative of two independent experiments.
FIGURE 8.
FIGURE 8.
CREB mediates PGD2-induced MUC5B gene expression independent of Ca2+ signaling. A, confluent and quiescent cells were treated with PGD2 (1 μm) for 5, 10, 20, 30, and 60 min, and cell lysates were processed for Western blot analysis using phospho-specific antibodies. β-Actin was used as an internal control. B, quantitation of the p-CREB/CREB ratio is shown. The results of Western blot analyses are representative of three separate experiments. C, cells were transfected with siCREB (40 nm) or siRNA-negative control (40 nm) and stimulated with PGD2 (1 μm) for 10 min before Western blot analysis. D, cells were serum-starved overnight, stimulated with PGD2 (1 μm) for 24 h, and analyzed using real time quantitative RT-PCR. MUC5B expression was determined relative to that of β2M using real-time quantitative PCR. The figures are representative of three independent experiments. Data are expressed as the mean ± S.D. C, untreated control; *, p < 0.05 versus PGD2 treatment alone. E, fluorescence images are shown to indicate interaction between two proteins. Staining with primary anti-CREB goat polyclonal and anti-RSK1 rabbit polyclonal antibodies was followed by species-specific secondary antibodies with PLA probes. PLA signaling (red dots) was detected in NCI-H292 cells using confocal microscopy (60×). F, cells were serum-starved overnight and then treated with the indicated concentrations of PGD2 for 1 h, after which cAMP production was measured. The values shown are the means ± S.D. of experiments performed in triplicate. G, shown are fluorescence changes in response to PGD2 in NCI-H292 cells (10 μm). PGD2 in DMSO was added to Fluo-2/AM-labeled cells (arrow 1), and ATP (100 μm) was added after 8 min (arrow 2). The mean basal level of [Ca2+]i was measured for 1 min before any treatment. Blue areas represent basal [Ca2+]i, and green and red areas represent an increase from base line. [Ca2+]i versus time is shown for 10 cells (left). Colored lines show the trace of [Ca2+]i mobilization in individual cells (right). Results are representative of two independent experiments.
FIGURE 9.
FIGURE 9.
PGD2 enhances MUC5B promoter activity via cis-acting CRE regulatory motifs. A, cells were transiently transfected with various MUC5B promoter luciferase reporter constructs and stimulated with PGD2 (1 μm) for 24 h. Luciferase activity was measured in PGD2-treated and untreated cells. *, p < 0.05 versus −530/+92 reporter construct. B, cells were transfected with MUC5B promoter constructs containing mutated CRE sites as indicated. Cells were treated with PGD2 (1 μm) for 24 h and then harvested. The luciferase activities shown have been corrected for transfection efficiency using the β-galactosidase activity of the cell lysates. Data are expressed as the mean ± S.D. of experiments performed in triplicate cultures. *, p < 0.05 versus wild-type treated with PGD2 (1 μm). C, cells were stimulated with PGD2 (1 μm) for 20 min. Cross-linked protein-DNA complexes were immunoprecipitated using CREB antibody or normal rabbit IgG that either amplified the CREB binding flanking region in MUC5B promoter (CRE site) or a region farther upstream that did not contain a CREB-binding site (Non-CRE site). The immunoprecipitated chromatin was analyzed with PCR using primers specific to the indicated site. Input chromatin represents a portion of the sonicated chromatin before immunoprecipitation. Control IgG (C), goat anti-rabbit IgG (negative control for ChIP). D, the results were analyzed using real-time PCR and are shown as the percentage of input. The results are shown as means ± S.D. calculated from three independent experiments.

Similar articles

Cited by

References

    1. Ali M. S., Pearson J. P. (2007) Laryngoscope 117, 932–938 - PubMed
    1. Rogers D. F. (1994) Eur. Respir. J. 7, 1690–1706 - PubMed
    1. Yuta A., Ali M., Sabol M., Gaumond E., Baraniuk J. N. (1997) Am. J. Physiol. 273, L1203–L1207 - PubMed
    1. Voynow J. A., Gendler S. J., Rose M. C. (2006) Am. J. Respir. Cell Mol. Biol. 34, 661–665 - PubMed
    1. Borchers M. T., Carty M. P., Leikauf G. D. (1999) Am. J. Physiol. 276, L549–L555 - PubMed

Publication types

MeSH terms

Substances

LinkOut - more resources