

Chemical genetics analysis of an aniline mustard anticancer agent reveals complex I of the electron transport chain as a target
- PMID: 21832047
- PMCID: PMC3190774
- DOI: 10.1074/jbc.M111.278390
Chemical genetics analysis of an aniline mustard anticancer agent reveals complex I of the electron transport chain as a target
Abstract
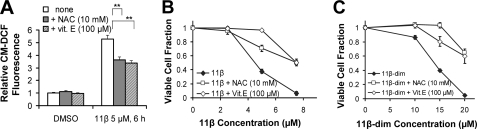
The antitumor agent 11β (CAS 865070-37-7), consisting of a DNA-damaging aniline mustard linked to an androgen receptor (AR) ligand, is known to form covalent DNA adducts and to induce apoptosis potently in AR-positive prostate cancer cells in vitro; it also strongly prevents growth of LNCaP xenografts in mice. The present study describes the unexpectedly strong activity of 11β against the AR-negative HeLa cells, both in cell culture and tumor xenografts, and uncovers a new mechanism of action that likely explains this activity. Cellular fractionation experiments indicated that mitochondria are the major intracellular sink for 11β; flow cytometry studies showed that 11β exposure rapidly induced oxidative stress, mitochondria being an important source of reactive oxygen species (ROS). Additionally, 11β inhibited oxygen consumption both in intact HeLa cells and in isolated mitochondria. Specifically, 11β blocked uncoupled oxygen consumption when mitochondria were incubated with complex I substrates, but it had no effect on oxygen consumption driven by substrates acting downstream of complex I in the mitochondrial electron transport chain. Moreover, 11β enhanced ROS generation in isolated mitochondria, suggesting that complex I inhibition is responsible for ROS production. At the cellular level, the presence of antioxidants (N-acetylcysteine or vitamin E) significantly reduced the toxicity of 11β, implicating ROS production as an important contributor to cytotoxicity. Collectively, our findings establish complex I inhibition and ROS generation as a new mechanism of action for 11β, which supplements conventional DNA adduct formation to promote cancer cell death.
Figures


Similar articles
-
Respiration in adipocytes is inhibited by reactive oxygen species.Obesity (Silver Spring). 2010 Aug;18(8):1493-502. doi: 10.1038/oby.2009.456. Epub 2009 Dec 24. Obesity (Silver Spring). 2010. PMID: 20035277 Free PMC article.
-
Forty percent methionine restriction decreases mitochondrial oxygen radical production and leak at complex I during forward electron flow and lowers oxidative damage to proteins and mitochondrial DNA in rat kidney and brain mitochondria.Rejuvenation Res. 2009 Dec;12(6):421-34. doi: 10.1089/rej.2009.0902. Rejuvenation Res. 2009. PMID: 20041736
-
Increased Intracellular Reactive Oxygen Species Mediates the Anti-Cancer Effects of WZ35 via Activating Mitochondrial Apoptosis Pathway in Prostate Cancer Cells.Prostate. 2017 Apr;77(5):489-504. doi: 10.1002/pros.23287. Epub 2016 Dec 19. Prostate. 2017. PMID: 27990666
-
Celastrol targets mitochondrial respiratory chain complex I to induce reactive oxygen species-dependent cytotoxicity in tumor cells.BMC Cancer. 2011 May 14;11:170. doi: 10.1186/1471-2407-11-170. BMC Cancer. 2011. PMID: 21569548 Free PMC article.
-
Production of reactive oxygen species in brain mitochondria: contribution by electron transport chain and non-electron transport chain sources.Antioxid Redox Signal. 2005 Sep-Oct;7(9-10):1140-9. doi: 10.1089/ars.2005.7.1140. Antioxid Redox Signal. 2005. PMID: 16115017 Review.
Cited by
-
A synthetic agent ameliorates polycystic kidney disease by promoting apoptosis of cystic cells through increased oxidative stress.Proc Natl Acad Sci U S A. 2024 Jan 23;121(4):e2317344121. doi: 10.1073/pnas.2317344121. Epub 2024 Jan 19. Proc Natl Acad Sci U S A. 2024. PMID: 38241440 Free PMC article.
-
Aniline TFPA enhances camptothecin-induced anti-NSCLC by modulating oxidative stress and impairing autophagy.Cancer Cell Int. 2025 Mar 7;25(1):81. doi: 10.1186/s12935-025-03657-6. Cancer Cell Int. 2025. PMID: 40055698 Free PMC article.
-
The cytotoxicity of benzaldehyde nitrogen mustard-2-pyridine carboxylic acid hydrazone being involved in topoisomerase IIα inhibition.Biomed Res Int. 2014;2014:527042. doi: 10.1155/2014/527042. Epub 2014 Jun 5. Biomed Res Int. 2014. PMID: 24995306 Free PMC article.
-
Proteomics analysis of chronic skin injuries caused by mustard gas.BMC Med Genomics. 2022 Aug 6;15(1):175. doi: 10.1186/s12920-022-01328-3. BMC Med Genomics. 2022. PMID: 35933451 Free PMC article.
-
Targeting cancer cell mitochondria as a therapeutic approach.Future Med Chem. 2013 Jan;5(1):53-67. doi: 10.4155/fmc.12.190. Future Med Chem. 2013. PMID: 23256813 Free PMC article. Review.
References
-
- Ruan K., Song G., Ouyang G. (2009) J. Cell. Biochem. 107, 1053–1062 - PubMed
-
- Ozben T. (2007) J. Pharm. Sci. 96, 2181–2196 - PubMed
-
- Ravid A., Rocker D., Machlenkin A., Rotem C., Hochman A., Kessler-Icekson G., Liberman U. A., Koren R. (1999) Cancer Res. 59, 862–867 - PubMed
-
- Wallach-Dayan S. B., Izbicki G., Cohen P. Y., Gerstl-Golan R., Fine A., Breuer R. (2006) Am. J. Physiol. Lung Cell Mol. Physiol. 290, L790–796 - PubMed
Publication types
MeSH terms
Substances
Grants and funding
LinkOut - more resources
Full Text Sources
Other Literature Sources
Research Materials
