. 2011 Sep 30;286(39):33863-71.
doi: 10.1074/jbc.M111.252312. Epub 2011 Aug 5.

Truncation of murine CaV1.2 at Asp-1904 results in heart failure after birth

Affiliations

Truncation of murine CaV1.2 at Asp-1904 results in heart failure after birth

Katrin Domes et al. J Biol Chem. .

Abstract

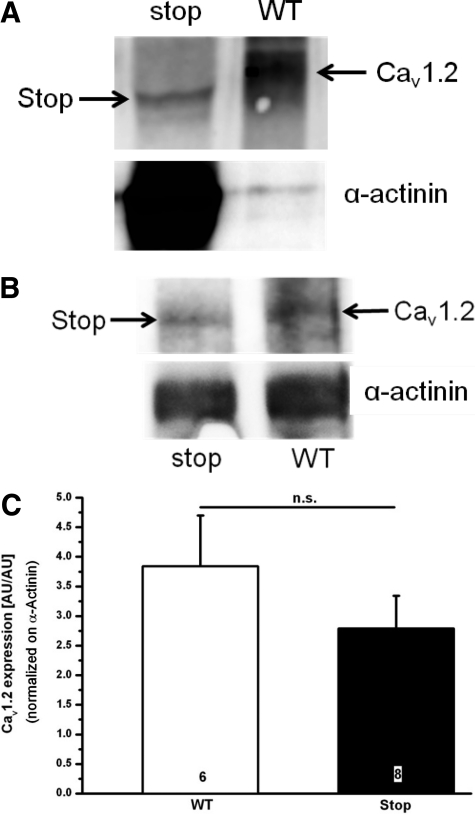
The carboxyl-terminal intracellular tail of the L-type Ca(2+) channel CaV1.2 modulates various aspects of channel activity.For example, deletion of the carboxyl-terminal sequence at Ser-1905 increased CaV1.2 currents in an expression model. To verify this finding in an animal model, we inserted three stop codons at the corresponding Asp-1904 in the murine CaV1.2 gene. Mice homozygous for the Stop mutation (Stop/Stop mice)were born at a Mendelian ratio but died after birth. Stop/Stop hearts showed reduced beating frequencies and contractions.Surprisingly, Stop/Stop cardiomyocytes displayed reduced IBa and a minor expression of the CaV1.2Stop protein. In contrast,expression of the CaV1.2Stop protein was normal in pooled smooth muscle samples from Stop/Stop embryos. As the CaV1.2 channel exists in a cardiac and smooth muscle splice variant, HK1 and LK1, respectively, we analyzed the consequences of the deletion of the carboxyl terminus in the respective splice variant using the rabbit CaV1.2 clone expressed in HEK293 cells.HEK293 cells transfected with the HK1Stop channel showed a reduced IBa and CaV1.2 expression. Treatment with proteasome inhibitors increased the expression of HK1Stop protein and IBa in HEK293 cells and in Stop/Stop cardiomyocytes indicating that truncation of CaV1.2 containing the cardiac exon 1a amino terminus results in proteasomal degradation of the translated protein. In contrast, HEK293 cells transfected with the LK1Stop channel had normal IBa and CaV1.2 expression. These findings indicate that absence of the carboxyl-terminal tail differentially determines the fate of the cardiac and smooth muscle splice variant of the CaV1.2 channel in the mouse.


Figures

FIGURE 1.
FIGURE 1.
Generation and biochemical analysis of CaV1.2D1904Stop/D1904Stop mice. A, top panel: genomic DNA structure of CACNA1C with the relevant restriction enzyme sites; boxes represent exons 44–47 encoding the C terminus of Cav1.2. Middle panel, targeting vector. Neo, neomycin resistance gene; TK, thymidine kinase gene with the loxP sequence (triangles) at both sides. The insertion of the three stop codons after aspartate 1904 is shown. Bottom panel, knock-in locus after homologous recombination and Cre-mediated deletion of resistance markers. The 5′ probe, which contains genomic sequence outside of the targeting vector, is depicted as a solid bar. K, KpnI; N, NotI; B, BamHI; C, ClaI; X, XhoI; P, PstI; kb, kilobases. B, top panel: sequence analysis of genomic DNA in the region coding for Asp-1904 from Cav1.2asp1904Stop/asp1904Stop mice. Bottom panel: Southern blot using the 5′ probe. Wild type (+/+) and heterozygote (+/Stop) sequence are indicated. C, distribution of WT, WT/Stop, and Stop/Stop embryos at day E18.5 and newborns at day postnatal day 7. D, left panel: Western blot of CaV1.2, sodium calcium exchanger 1 (NCX1), α-actinin, phospho-MAPK (p-MAPK), MAPK, and GAPDH proteins in hearts from WT (+/+), WT/Stop (+/Stop), and Stop/Stop E18 embryos. Right panel, Western blot of CaV1.2, CaV1.3, and β-actin in hearts from WT (+/+) and Stop/Stop E18.5 embryos. Hearts were isolated from individual embryos and processed as described under “Experimental Procedures.” 20 μg protein was loaded per gel slot. Western blot technique and antibodies are described under “Experimental Procedures.” The blot is representative for three very similar blots. E, cardiac circumferences were measured in paraffin section of E18.5 hearts. F, the thickness of the cardiac septum was measured in paraffin section of E18.5 hearts. The number of embryos/animals analyzed is shown in the columns. Genotype was analyses by PCR. For more information, see “Experimental Procedures.”
FIGURE 2.
FIGURE 2.
Functional analysis of cardiac activity. A and B, electrophysiological analysis of isolated ventricular CMs from E18.5 hearts. A, original recordings of IBa. CMs were stimulated by the voltage pulse depicted above. B, current/voltage relation of IBa. Current is expressed as current density. Curves for WT/WT versus WT/Stop and WT/WT versus Stop/Stop were statistically different (for details, see “Experimental Procedures”). Cardiac cells were isolated from at least three embryos obtained from three independent pregnant mothers (WT/WT = 12; WT/Stop = 17; Stop/Stop = 13). C, electrocardiograms of a WT/WT (upper trace) and a Stop/Stop (lower trace) pup delivered by Cesarean section on day E18.5. D, heart rate of WT/WT, WT/Stop, and Stop/Stop pups delivered by Cesarean section on day E18.5. Heart rate (bpm) was determined by ECG recording. E, traces of force development of a WT/WT (upper trace) and a Stop/Stop (lower trace) heart from pups delivered by Cesarean section on day E18.5. F, force of contraction in mN of WT/WT, WT/Stop, and Stop/Stop hearts of pups delivered by Cesarean section on day E18.5. The number of embryos/animals analyzed is shown in the columns. Genotype was analyzed by PCR. For further information see Experimental Procedures. Significant differences are indicated by **, p < 0.01, and ***, p < 0.001.
FIGURE 3.
FIGURE 3.
CaV1.2 expression in heart and non-heart tissues. A, Western blot of cardiac tissue from WT/WT and Stop/Stop E18.5 embryos. Upper panel, CaV1.2; lower panel, α-actinin as loading control. Please note that quite different amounts of protein were loaded on the 6% SDS-PAGE. Two (WT) and 50 (Stop) μg protein extract were loaded per slot. Samples were electrophoresed on the same gel. B, Western blot of non-cardiac, non-brain tissue from WT/WT and Stop/Stop E18.5 embryos. Upper panel, CaV1.2; lower panel, α-actinin. 150 μg protein extract were loaded per slot. Samples were electrophoresed on a 6% SDS-PAGE. C, statistics of the density of CaV1.2 band shown as arbitrary units normalized for the α-actinin loading control. Tissues were obtained from E18.5 embryos obtained from six to eight mothers. n.s., not significantly different. AU, arbitrary units.
FIGURE 4.
FIGURE 4.
Analysis of HEK293 cells transfected with the full-length HK1 (Cav1. 2a) and LK1 (Cav1.2b), the corresponding truncated constructs HK1stop, LK1stop, and the LK4stop construct. All transfections were concomitantly performed with CaV1.2α2-1 and CaV1.2β2a cDNA. A, scheme for splice variants of CaV1.2. The black boxes labeled A, B, C, and D indicate the differences between the HK1 (CaV1.2a) and smooth muscle LK1 (CaV1.2b). The HK1stop and LK1stop were truncated at Ser-1905, which correspond to Asp-1904 in the murine CaV1.2 gene. LK4stop contains the sequence of the cardiac HK1stop (CaV1.2a) with the exception that the amino terminus is the smooth muscle exon 1b (box A). B, original recordings of IBa. HEK293 were transfected with HK1 and HK1Stop. Cells were stimulated by the voltage pulse depicted above. C, current-voltage relation of IBa. HEK293 cells were transfected with HK1 and HK1Stop. Current is expressed as current density. Curves for HK1 (n = 20) and HK1stop (n = 12) were statistically different. D, original recordings of IBa. HEK293 cells were transfected with LK1, LK1Stop, LK4Stop, and HK1Stop and stimulated by the voltage pulse depicted above. E, current/voltage relation of IBa. HEK293 cells were transfected with LK1, LK1Stop, LK4Stop, and HK1Stop. Current is expressed as current density. Curves for LK1, LK1Stop, and LK4Stop were not statistically different. Data points represent mean ± S.E. with n = 7 for LK1, n = 13 for LK1stop, n = 6 for LK4stop, and n = 12 for HK1stop.
FIGURE 5.
FIGURE 5.
Western blot of HEK293 cells transfected with the full-length HK1 (Cav1.2a) and LK1 (Cav1.2b), the corresponding truncated constructs HK1stop, LK1stop, and the LK4stop construct. The upper and bottom panels show CaV1.2 protein, and the middle panel shows GAPDH as a loading control. Proteins were separated on a 8% (upper and middle panel) or a 6% (bottom panel) SDS-PAGE gel. 20 μg protein were loaded per slot. The left three lanes and the right four lanes are from distinct gels. Transfection and Western blotting were repeated five times.
FIGURE 6.
FIGURE 6.
Rescue of the truncated HK1stop channel by proteasome inhibitors. A and B, Western blot from HEK293 cells transfected with the full-length HK1and the truncated HK1stop construct together with CaVα2–1 and CaVβ2a cDNA in the absence and presence of lactacystin (L; 10 μm) and MG132 (M; 10 μm) (A) and in the absence and presence of bortezomib (B; 10 μm) (B). Cells were cultured for 48 h with proteasome inhibitors added for the last 12 h. Proteins were separated on an 8% SDS-PAGE gel. Transfection and Western blots were repeated at least three times with similar results. See statistics in Fig. 4, D–F. C, original recordings of IBa in HEK293 cells transfected with the truncated HK1stop construct. Cells were treated with lactacystin (10 μm) and MG132 (10 μm) for the last 12 h. Cells were stimulated by the voltage pulse depicted above. D, current density of IBa elicited at 20 mV. HEK293 cells transfected with full-length HK1 and the truncated HK1stop. Transfected cells were or were not treated with lactacystin and MG132 (10 μm each) for the last 12 h. E, current density of IBa elicited at 10 mV in HEK293 cells transfected with the truncated HK1stop. Cells were or were not treated with bortezomib (10 μm) for the last 12 h. IBa recordings were determined also in the presence of isradipine (ISR, 1 μm) in some cells treated with bortezomib. F, current density of IBa in E18.5 CMs from WT, WT/Stop, and Stop/Stop mice. CMs were or were not treated with bortezomib (10 μm) for the last 12 h. The number of cells isolated from four to six embryos is shown in the columns. Genotype was analyzed by PCR. For more information, see “Experimental Procedures.” Significant differences are indicated by *, p < 0.05, **, p < 0.01, and ***, p < 0.001; n.s., non-significant.

Similar articles

Cited by

References

    1. Catterall W. A. (2000) Annu. Rev. Cell Dev. Biol. 16, 521–555 - PubMed
    1. Seisenberger C., Specht V., Welling A., Platzer J., Pfeifer A., Kühbandner S., Striessnig J., Klugbauer N., Feil R., Hofmann F. (2000) J. Biol. Chem. 275, 39193–39199 - PubMed
    1. Moosmang S., Schulla V., Welling A., Feil R., Feil S., Wegener J. W., Hofmann F., Klugbauer N. (2003) EMBO J. 22, 6027–6034 - PMC - PubMed
    1. Wegener J. W., Schulla V., Lee T. S., Koller A., Feil S., Feil R., Kleppisch T., Klugbauer N., Moosmang S., Welling A., Hofmann F. (2004) FASEB J. 18, 1159–1161 - PubMed
    1. Wegener J. W., Schulla V., Koller A., Klugbauer N., Feil R., Hofmann F. (2006) FASEB J. 20, 1260–1262 - PubMed

Publication types

MeSH terms

Substances