. 2011 Sep 30;286(39):34311-24.
doi: 10.1074/jbc.M111.264671. Epub 2011 Aug 8.

The Rho1 GTPase-activating protein CgBem2 is required for survival of azole stress in Candida glabrata

Affiliations

The Rho1 GTPase-activating protein CgBem2 is required for survival of azole stress in Candida glabrata

Sapan Borah et al. J Biol Chem. .

Abstract

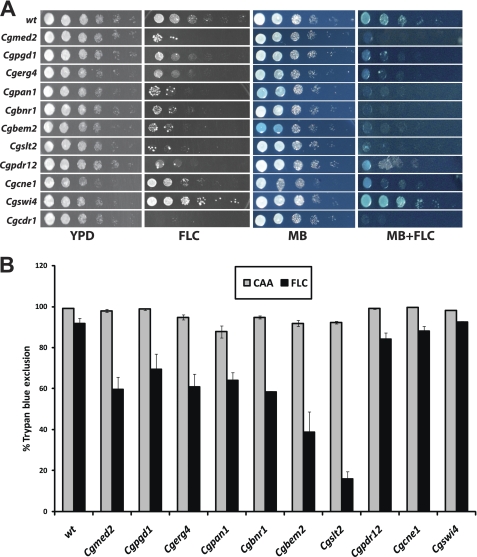
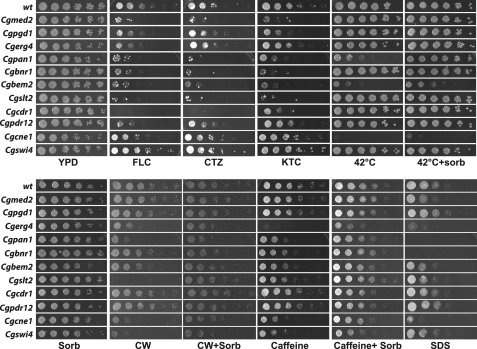
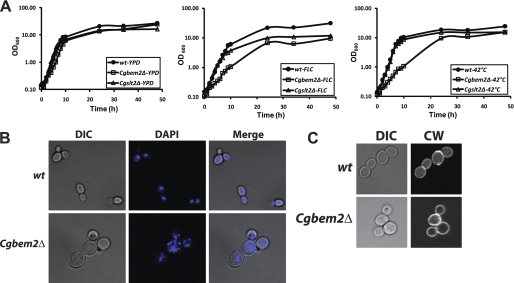
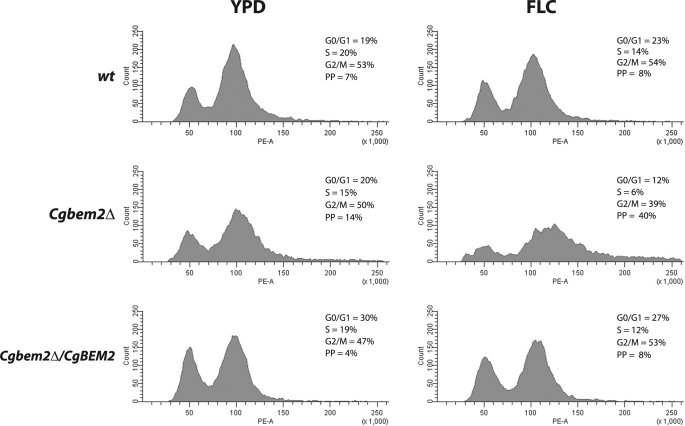
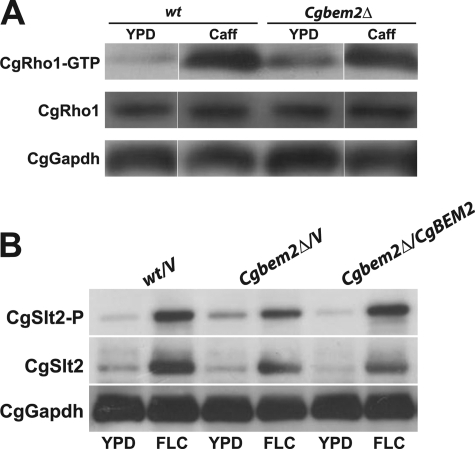
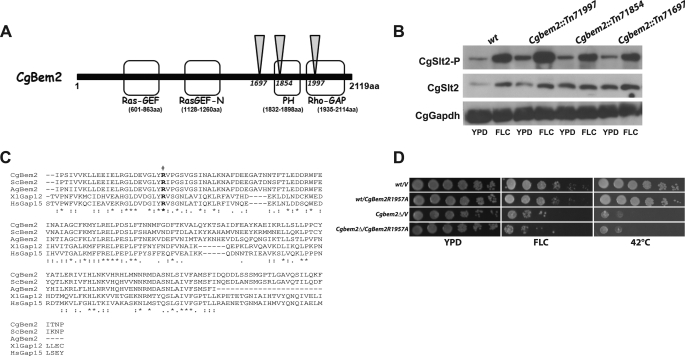
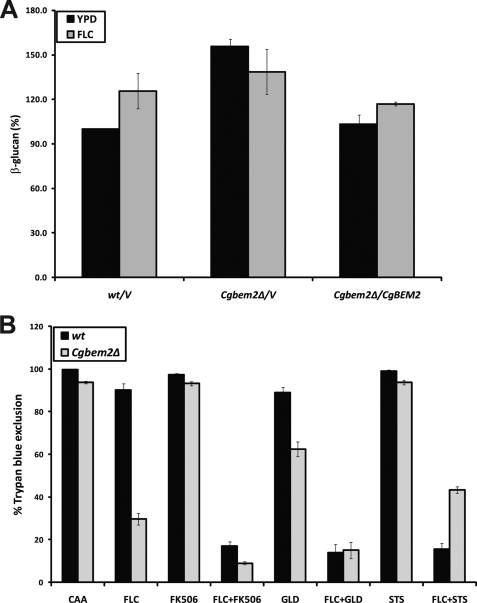
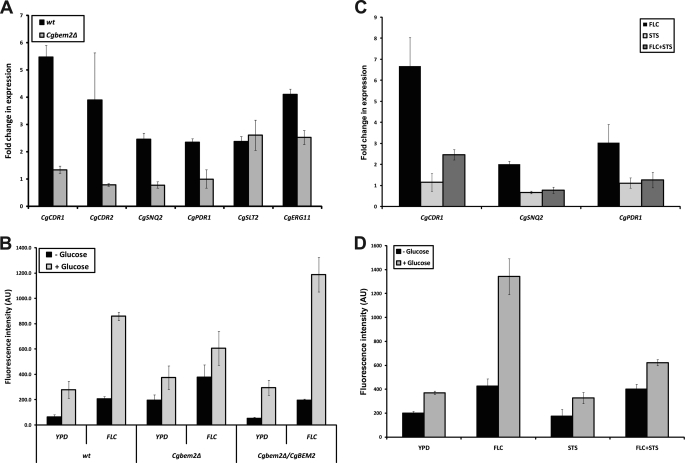
Invasive fungal infections are common clinical complications of neonates, critically ill, and immunocompromised patients worldwide. Candida species are the leading cause of disseminated fungal infections, with Candida albicans being the most prevalent species. Candida glabrata, the second/third most common cause of candidemia, shows reduced susceptibility to a widely used antifungal drug fluconazole. Here, we present findings from a screen of 9134 C. glabrata Tn7 insertion mutants for altered survival profiles in the presence of fluconazole. We have identified two components of RNA polymerase II mediator complex, three players of Rho GTPase-mediated signaling cascade, and two proteins implicated in actin cytoskeleton biogenesis and ergosterol biosynthesis that are required to sustain viability during fluconazole stress. We show that exposure to fluconazole leads to activation of the protein kinase C (PKC)-mediated cell wall integrity pathway in C. glabrata. Our data demonstrate that disruption of a RhoGAP (GTPase activating protein) domain-containing protein, CgBem2, results in bud-emergence defects, azole susceptibility, and constitutive activation of CgRho1-regulated CgPkc1 signaling cascade and cell wall-related phenotypes. The viability loss of Cgbem2Δ mutant upon fluconazole treatment could be partially rescued by the PKC inhibitor staurosporine. Additionally, we present evidence that CgBEM2 is required for the transcriptional activation of genes encoding multidrug efflux pumps in response to fluconazole exposure. Last, we report that Hsp90 inhibitor geldanamycin renders fluconazole a fungicidal drug in C. glabrata.


Figures

FIGURE 1.
FIGURE 1.
C. glabrata mutants defective in RNA polymerase II-dependent transcription and PKC-mediated signaling lose viability in the presence of fluconazole. A, shown are growth profiles of C. glabrata fluconazole-sensitive mutants. A600 of overnight cultures was normalized to 1.0, and 3 μl of 10-fold serially diluted cultures were spotted onto YPD plates with or without 16 μg/ml fluconazole (FLC), 0.01% methylene blue (MB), or 16 μg/ml fluconazole, and 0.01% methylene blue (MB+FLC). Plates were photographed after 24–48 h of growth at 30 °C. B, a trypan blue exclusion assay assesses the viability of fluconazole-sensitive mutants in the presence of fluconazole. Cells were grown in CAA medium with or without 128 μg/ml fluconazole for 24 h, harvested, and washed twice with PBS. Cells were stained with 0.4% trypan blue, and a minimum of total 300 cells (stained (dead) and unstained (viable)) were counted microscopically for each strain. Cell viability data were plotted as the percentage of trypan blue exclusion and represent the mean of three to six independent analyses (±S.E.).
FIGURE 2.
FIGURE 2.
Disruption of Rho GTPase-mediated signaling leads to susceptibility to azoles and cell wall stress agents. Equal volumes of 10-fold serial dilutions of wild-type and mutant cultures were spotted onto YPD plates containing different stress agents at the following concentrations and growth was scored after 48 h: fluconazole (FLC, 16 μg/ml), clotrimazole (CTZ, 15 μg/ml), ketoconazole (KTC, 10 μg/ml), caffeine (10 mm), Calcofluor white (CW, 1.5 mg/ml), sorbitol (Sorb, 1 m), SDS (0.05%), and thermal stress (42 °C).
FIGURE 3.
FIGURE 3.
Disruption of CgBEM2 results in fluconazole and thermal stress sensitivity and bud-emergence defects. A, shown is growth curve analysis of WT, Cgbem2Δ, and Cgslt2Δ mutants in YPD medium at 30 and 42 °C and in YPD medium containing 16 μg/ml fluconazole. Absorbance at 600 nm was monitored over a 48-h time course at the indicated time intervals. Data are represented as mean values of two independent growth analyses. B, differential interference contrast (DIC) and fluorescence confocal images of DAPI stained Cgbem2Δ mutant reveal enlarged, multi-nucleated cells. Logarithmic phase C. glabrata cells were fixed, stained with 0.2 mg/ml DAPI for 40 min, and visualized using confocal microscopy. C, DIC and fluorescence confocal images of CW (1 mg/ml)-stained Cgbem2Δ mutant display diffused chitin staining, indicating delocalized cell surface growth. All the growth assays were performed at 30 °C unless mentioned otherwise.
FIGURE 4.
FIGURE 4.
Flow cytometric analyses of propidium iodide-stained wild-type, Cgbem2Δ, and Cgbem2Δ/CgBEM2 cells. Logarithmic phase C. glabrata cells were fixed with 70% ethanol, and flow cytometric analysis of DNA contents was carried out as described under “Experimental Procedures.” The x axis represents relative DNA content. The left-most peak represents the G1 population, and the right-most peak represents the G2 population. PP refers to polyploid population. Data shown are from one experiment and are representative of three independent experiments. FLC, fluconazole.
FIGURE 5.
FIGURE 5.
CgPkc1-mediated signaling cascade is constitutively active in Cgbem2Δ mutant. A, shown is a Western blot analysis detecting the GTP-bound form of CgRho1 on C. glabrata cells grown in the presence of 10 mm caffeine (Caff) for 4 h. Experimental details are outlined under “Experimental Procedures.” B, shown is a Western blot analysis detecting the total and phospho form of CgSlt2 on C. glabrata cells grown either in YPD or YPD medium containing 16 μg/ml fluconazole (FLC) for 4 h. Activation of CgSlt2 was examined by probing the blot with anti-phospho-p44/42 MAPK antibody that recognizes the dual-phosphorylated form of CgSlt2. CgGapdh was used as a loading control.
FIGURE 6.
FIGURE 6.
RhoGAP domain of CgBem2 is required for fluconazole tolerance. A, shown is a schematic illustration of the predicted domains of CgBem2 protein. Inverted triangles indicate the positions of Tn7 insertions in identified Cgbem2 mutants. The diagram is not drawn to scale. aa, amino acids. B, shown is a Western blot analysis detecting the total and phospho form of CgSlt2 on Cgbem2::Tn7 insertional mutants as indicated in the Fig. 5B legend. FLC, fluconazole. C, shown is a sequence comparison of the GAP domain of Rho-GAP proteins. A multiple alignment was calculated with ClustalW by using protein sequences of C. glabrata Bem2 (CgBem2), S. cerevisiae Bem2 (ScBem2), Ashbya gossypii Bem2 (AgBem2), Xenopus laevis RhoGAP protein 12 (XlGap12), and Homo sapiens RhoGAP protein 15 (HsGap15). The putative catalytic arginine residue is highlighted in bold and is also marked with the hash symbol. Stars indicate identical amino acids, and colons and dots represent similar amino acids. D, shown are growth profiles of the wild-type and Cgbem2Δ strain harboring either empty vector pRK74 or plasmid expressing mutated CgBem2R1957A in the presence of fluconazole and thermal stress (42 °C).
FIGURE 7.
FIGURE 7.
Fluconazole-induced viability loss in Cgbem2Δ mutant is partially rescued by inhibition of CgPkc1 signaling. A, β-glucan content of wild-type and Cgbem2 mutants grown either in YPD or in YPD medium containing 16 μg/ml fluconazole (FLC) was determined as described previously (32) and was expressed as μg of glucan/mg of dry weight of cell wall. Total amount of β-glucan quantified from YPD grown wild-type cells was normalized to 100%, and data presented are relative to the β-glucan levels in WT cell wall under standard growth conditions. Cell wall analysis was independently carried out three-four times, and error bars represent S.E. B, the fungicidal nature of fluconazole was assessed by growing cultures for 24 h in the presence of 2 μg/ml FK506, 25 μm geldanamycin, and 2 μg/ml staurosporine in medium with or without 128 μg/ml fluconazole followed by viability assessment by trypan blue exclusion assay as outlined in Fig. 1B legend. Data represent the means ± S.E. of three-five independent experiments.
FIGURE 8.
FIGURE 8.
CgBEM2 is required for activation of multidrug efflux pumps in response to fluconazole. A, shown are qRT-PCR analyses of CgCDR1, CgCDR2, CgSNQ2, CgPDR1, CgSLT2, and CgERG11 genes on cells grown in 16 μg/ml fluconazole for 4 h. Assays were performed in duplicate with SYBR® Green dye using ABI PRISM® 7500 Sequence Detection System. Data were normalized to an internal CgGAPDH mRNA control, and the relative changes in transcriptional level upon fluconazole exposure were calculated as a ratio of the transcript levels of treated cells versus non-treated cells using the 2−ΔΔCT method. Data represent the means of 3–5 independent experiments ± S.E. B, efflux of R6G in wild-type and mutant cultures grown for 4 h in the absence or presence of 16 μg/ml fluconazole (FLC). De-energized cells were incubated with 10 μm R6G at 30 °C for 2 h, and cells were rapidly harvested. Active efflux of R6G was initiated by the addition of 2 mm glucose to energy-starved, R6G-preloaded cells, and the extracellular concentration of R6G in the supernatant was determined fluorometrically 20 min post-glucose addition. Data are from three to five independent analyses ± S.E. AU represents arbitrary units. C, shown are qRT-PCR analyses of CgCDR1, CgSNQ2, and CgPDR1 genes on wild-type cells grown for 4 h under different conditions. Fluconazole and staurosporine (STS) were used at a concentration of 16 and 1 μg/ml, respectively. Assays were performed in duplicate as described in A. Data represent the mean ± S.E. of three to four independent experiments. D, efflux of R6G in wild-type cells grown for 4 h under different conditions was assessed as described in B is shown. Fluconazole and staurosporine were used at the concentration of 16 and 1 μg/ml, respectively. Data represent the mean ± S.E. of three independent experiments.

Similar articles

Cited by

References

    1. Messer S. A., Jones R. N., Fritsche T. R. (2006) J. Clin. Microbiol. 44, 1782–1787 - PMC - PubMed
    1. Pfaller M. A., Diekema D. J. (2007) Clin. Microbiol. Rev. 20, 133–163 - PMC - PubMed
    1. Pfaller M. A., Diekema D. J., Gibbs D. L., Newell V. A., Ellis D., Tullio V., Rodloff A., Fu W., Ling T. A. (2010) J. Clin. Microbiol. 48, 1366–1377 - PMC - PubMed
    1. Hazen K. C., Baron E. J., Colombo A. L., Girmenia C., Sanchez-Sousa A., del Palacio A., de Bedout C., Gibbs D. L. (2003) J. Clin. Microbiol. 41, 5623–5632 - PMC - PubMed
    1. Grant S. M., Clissold S. P. (1990) Drugs 39, 877–916 - PubMed

Publication types

MeSH terms