

Intradomain cleavage of inhibitory prodomain is essential to protumorigenic function of membrane type-1 matrix metalloproteinase (MT1-MMP) in vivo
- PMID: 21832072
- PMCID: PMC3190797
- DOI: 10.1074/jbc.M111.264036
Intradomain cleavage of inhibitory prodomain is essential to protumorigenic function of membrane type-1 matrix metalloproteinase (MT1-MMP) in vivo
Abstract
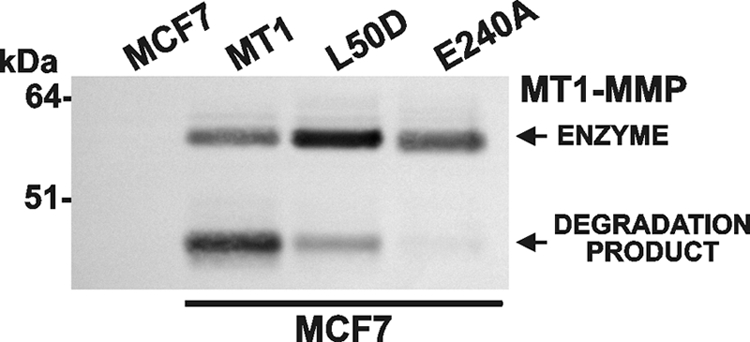
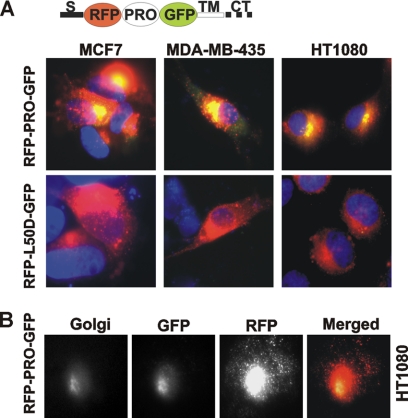
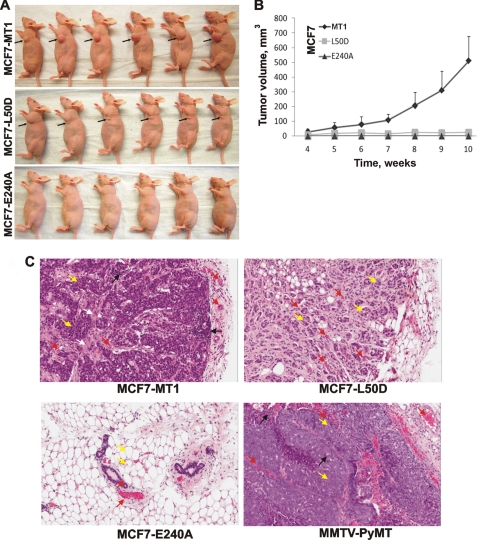
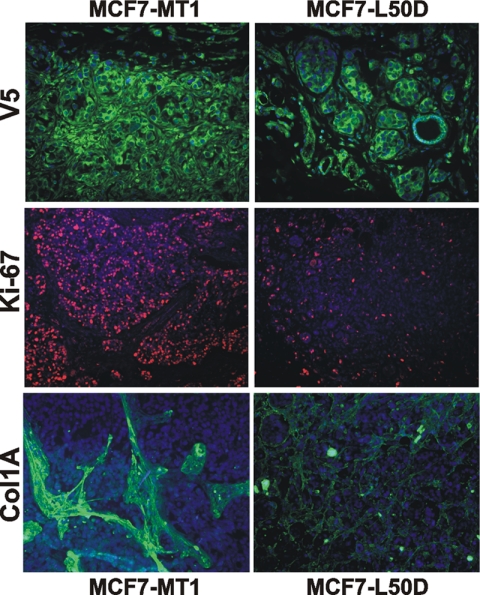
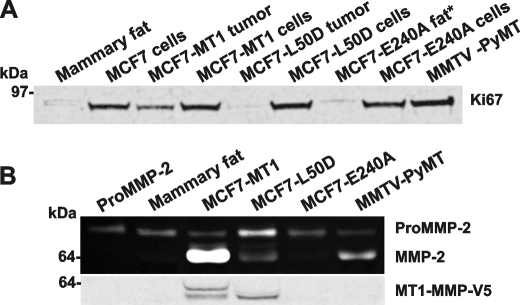
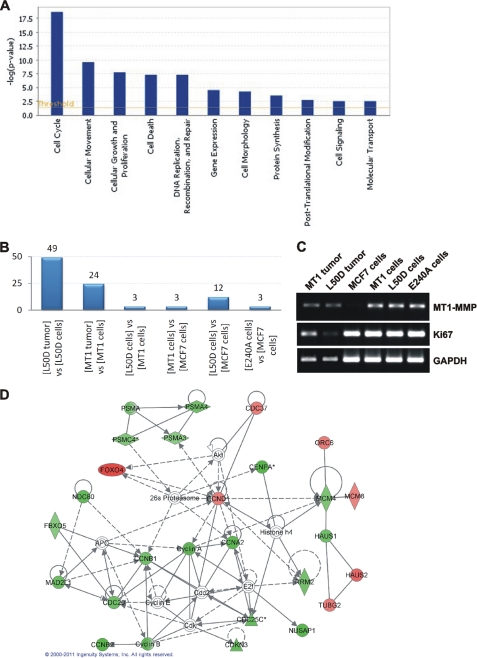
Invasive cancers use pericellular proteolysis to breach the extracellular matrix and basement membrane barriers and invade the surrounding tissue. Proinvasive membrane type-1 matrix metalloproteinase (MT1-MMP) is the primary mediator of proteolytic events on the cancer cell surface. MT1-MMP is synthesized as a zymogen. The latency of MT1-MMP is maintained by its N-terminal inhibitory prodomain. In the course of MT1-MMP activation, the R(108)RKR(111) ↓ Y(112) prodomain sequence is processed by furin. The intact prodomain released by furin alone, however, is a potent inhibitor of the emerging MT1-MMP enzyme. Evidence suggests that the prodomain undergoes intradomain cleavage at the PGD ↓ L(50) site followed by the release of the degraded prodomain by furin cleavage that finalizes the two-step activation event. These cleavages, only if combined, cause the activation of MT1-MMP. The significance of the intradomain cleavage in the protumorigenic program of MT1-MMP, however, remained unidentified. To identify this important parameter, in our current study, we used the cells that expressed the wild-type prodomain-based fluorescent biosensor and the mutant biosensor with the inactivated PGD↓L(50) cleavage site (L50D mutant) and also the cells with the enforced expression of the wild-type and L50D mutant MT1-MMP. Using cell-based tests, orthotopic breast cancer xenografts in mice, and genome-wide transcriptional profiling of cultured cells and tumor xenografts, we demonstrated that the intradomain cleavage of the PGD ↓ L(50) sequence of the prodomain is essential for the protumorigenic function of MT1-MMP. Our results emphasize the importance of the intradomain cleavages resulting in the inactivation of the respective inhibitory prodomains not only for MT1-MMP but also for other MMP family members.
Figures
Similar articles
-
Internal cleavages of the autoinhibitory prodomain are required for membrane type 1 matrix metalloproteinase activation, although furin cleavage alone generates inactive proteinase.J Biol Chem. 2010 Sep 3;285(36):27726-36. doi: 10.1074/jbc.M110.135442. Epub 2010 Jul 6. J Biol Chem. 2010. PMID: 20605791 Free PMC article.
-
Proteolysis of the membrane type-1 matrix metalloproteinase prodomain: implications for a two-step proteolytic processing and activation.J Biol Chem. 2007 Dec 14;282(50):36283-91. doi: 10.1074/jbc.M706290200. Epub 2007 Oct 15. J Biol Chem. 2007. PMID: 17938169
-
Prointegrin maturation follows rapid trafficking and processing of MT1-MMP in Furin-Negative Colon Carcinoma LoVo Cells.Traffic. 2004 Aug;5(8):627-41. doi: 10.1111/j.1600-0854.2004.00206.x. Traffic. 2004. PMID: 15260832
-
Emerging concepts in the regulation of membrane-type 1 matrix metalloproteinase activity.Biochim Biophys Acta. 2010 Jan;1803(1):142-50. doi: 10.1016/j.bbamcr.2009.04.011. Epub 2009 May 4. Biochim Biophys Acta. 2010. PMID: 19409422 Review.
-
Integrated functions of membrane-type 1 matrix metalloproteinase in regulating cancer malignancy: Beyond a proteinase.Cancer Sci. 2017 Jun;108(6):1095-1100. doi: 10.1111/cas.13231. Epub 2017 May 22. Cancer Sci. 2017. PMID: 28267240 Free PMC article. Review.
Cited by
-
Novel MT1-MMP small-molecule inhibitors based on insights into hemopexin domain function in tumor growth.Cancer Res. 2012 May 1;72(9):2339-49. doi: 10.1158/0008-5472.CAN-11-4149. Epub 2012 Mar 9. Cancer Res. 2012. PMID: 22406620 Free PMC article.
-
Matrix metalloproteinase 14 modulates signal transduction and angiogenesis in the cornea.Surv Ophthalmol. 2016 Jul-Aug;61(4):478-97. doi: 10.1016/j.survophthal.2015.11.006. Epub 2015 Dec 2. Surv Ophthalmol. 2016. PMID: 26647161 Free PMC article. Review.
-
Cancer module genes ranking using kernelized score functions.BMC Bioinformatics. 2012;13 Suppl 14(Suppl 14):S3. doi: 10.1186/1471-2105-13-S14-S3. Epub 2012 Sep 7. BMC Bioinformatics. 2012. PMID: 23095178 Free PMC article.
-
Extracellular matrix determinants and the regulation of cancer cell invasion stratagems.J Microsc. 2013 Sep;251(3):250-60. doi: 10.1111/jmi.12064. J Microsc. 2013. PMID: 23924043 Free PMC article. Review.
-
Non-destructive and selective imaging of the functionally active, pro-invasive membrane type-1 matrix metalloproteinase (MT1-MMP) enzyme in cancer cells.J Biol Chem. 2013 Jul 12;288(28):20568-80. doi: 10.1074/jbc.M113.471508. Epub 2013 Jun 3. J Biol Chem. 2013. PMID: 23733191 Free PMC article.
References
Publication types
MeSH terms
Substances
Grants and funding
LinkOut - more resources
Full Text Sources
Other Literature Sources
Medical
Molecular Biology Databases
Miscellaneous
