. 2011 Sep 15;187(6):3087-95.
doi: 10.4049/jimmunol.1003879. Epub 2011 Aug 10.

TRAIL/DR5 plays a critical role in NK cell-mediated negative regulation of dendritic cell cross-priming of T cells

Affiliations

TRAIL/DR5 plays a critical role in NK cell-mediated negative regulation of dendritic cell cross-priming of T cells

Mitsuhiro Iyori et al. J Immunol. .

Abstract

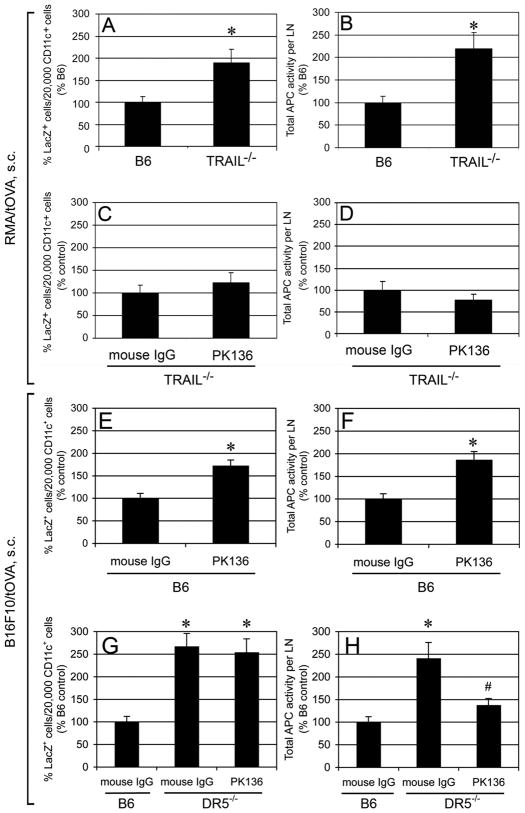
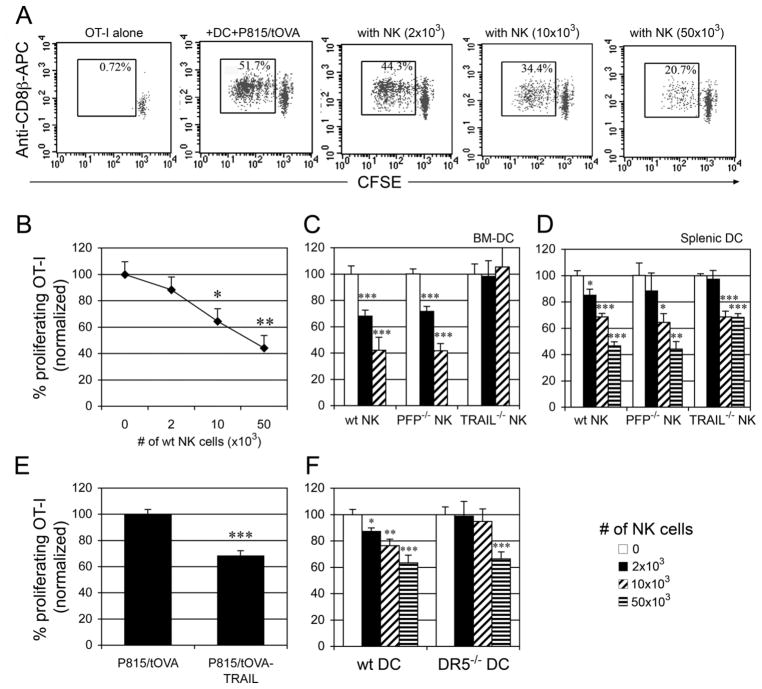
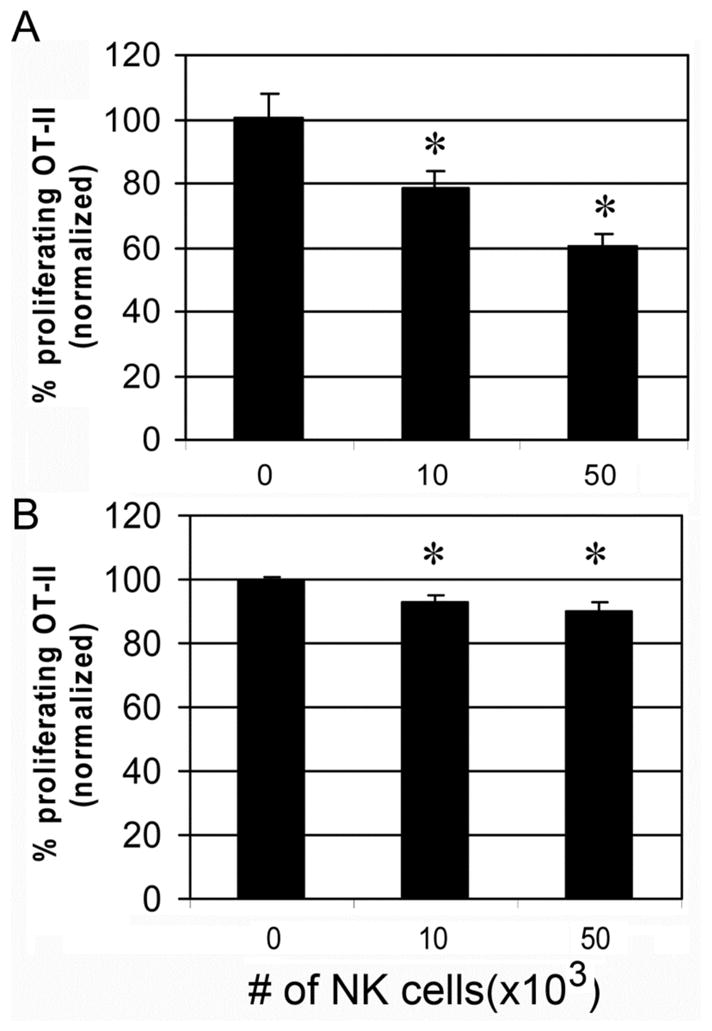
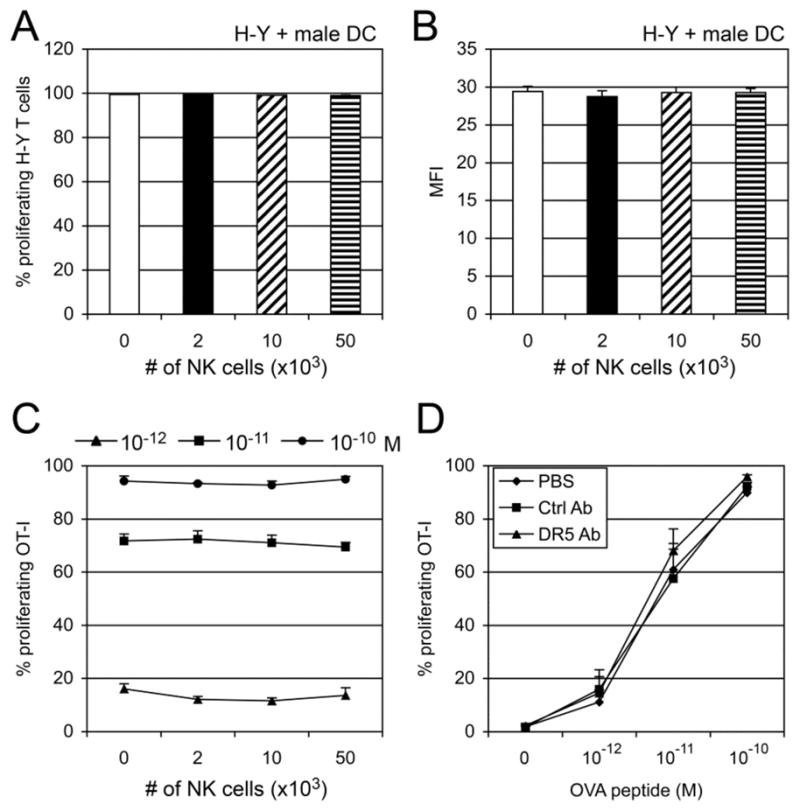
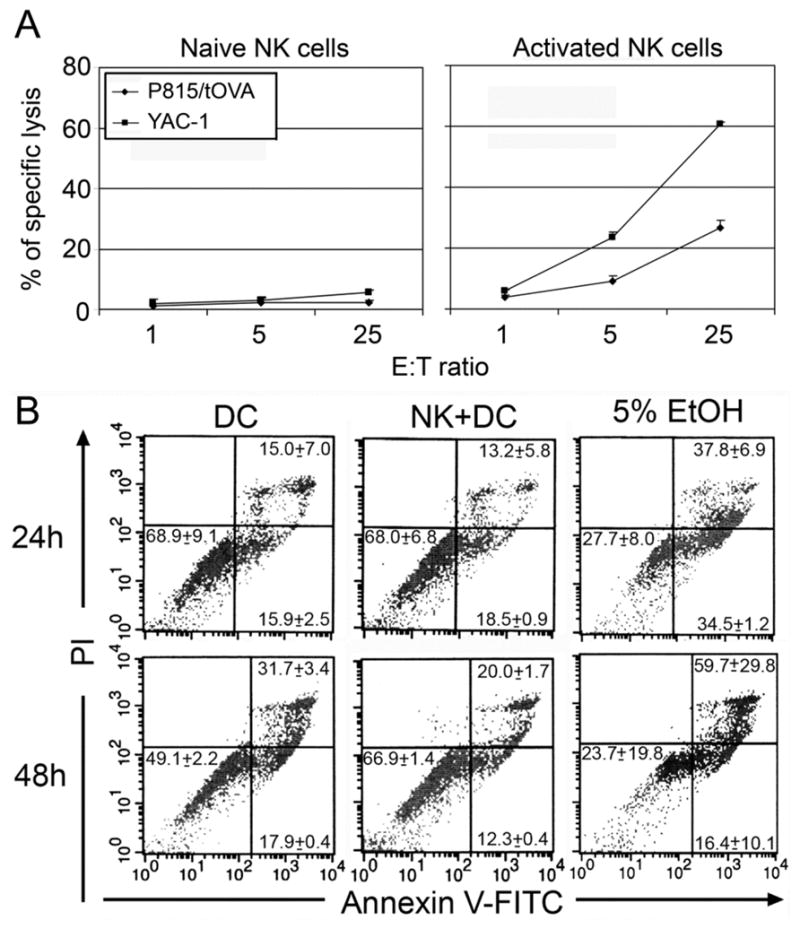
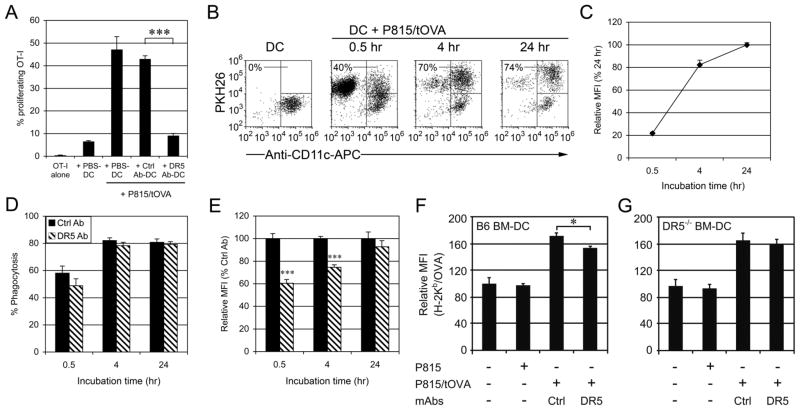
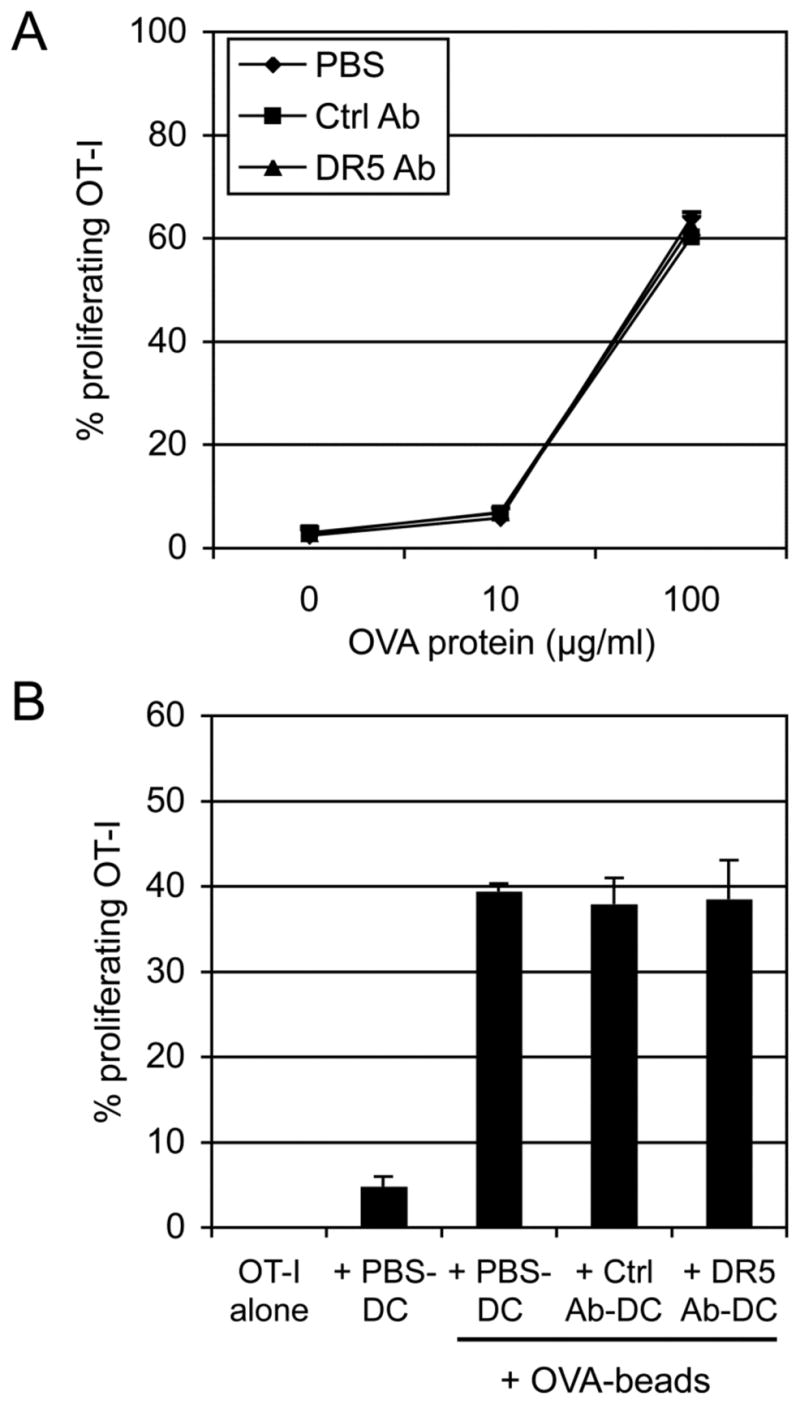
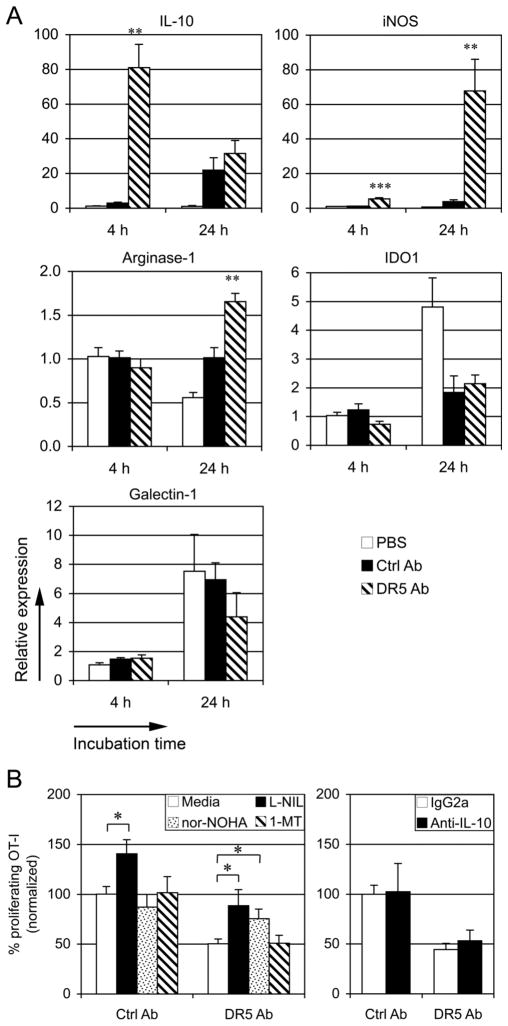
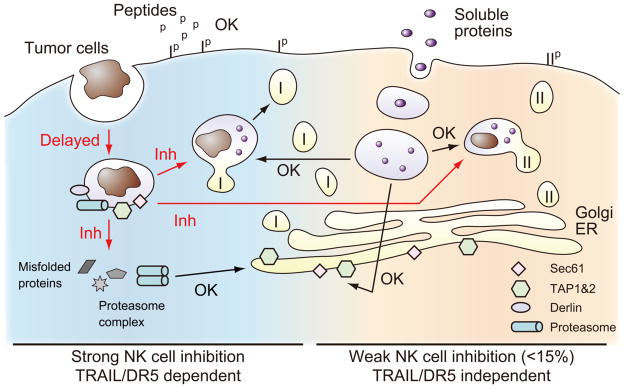
Dendritic cells (DCs) are critical in initiating immune responses by cross-priming of tumor Ags to T cells. Previous results showed that NK cells inhibited DC-mediated cross-presentation of tumor Ags both in vivo and in vitro. In this study, enhanced Ag presentation was observed in draining lymph nodes in TRAIL(-/-) and DR5(-/-) mice compared with that of wild-type mice. NK cells inhibit DC cross-priming of tumor Ags in vitro, but not direct presentation of endogenous Ags. NK cells lacking TRAIL, but not perforin, were not able to inhibit DC cross-priming of tumor Ags. DCs that lack expression of TRAIL receptor DR5 were less susceptible to NK cell-mediated inhibition of cross-priming, and cross-linking of DR5 receptor led to reduced generation of MHC class I-Ag peptide complexes, followed by attenuated cross-priming of CD8(+) T cells. In addition, key molecules involved in the TRAIL/DR5 pathway during DC/NK cell interactions were determined. In summary, these data indicate a novel alternative pathway for DC/NK cell interactions in antitumor immunity and may reflect homeostasis of both DCs and NK cells for regulation of CD8(+) T cell function in physiological conditions.


Conflict of interest statement

Conflict of interest

The authors declare no financial or commercial conflict of interest.

Figures

FIGURE 1
FIGURE 1. DC cross-presentation of tumor antigens was inhibited by NK cells through TRAIL/DR5 in vivo
B6 mice, TRAIL−/− mice or DR5−/− mice were inoculated with 106 RMA/tOVA cells (AD) or 5 × 10⁵ B16F10/tOVA cells (EH). Anti-NK1.1 or control mouse γ-globulin was injected into mice i.p. at days −2 and +3 relative to tumor inoculation at day 0 (CH). 5 days after the inoculation, DC-enriched LNs were cocultured with B3Z cells for 24 hr. Results are expressed as percentage of LacZ+ B3Z cells per 2 × 10⁴ CD11c+ cells and total APC activity per LN. Cumulative data from three independent experiments are shown as mean ± SEM. * p < 0.05, # p < 0.05, compared to DR5−/− mouse IgG, but p > 0.05, compared to B6 mouse IgG.
FIGURE 2
FIGURE 2. NK cells inhibit DC cross-priming through TRAIL/DR5
(A) CFSE-labeled OVA-specific OT-I T cells (5 × 10⁴) were co-cultured with splenic DCs (2 × 10⁴), P815/t-OVA cells (2 × 10⁴) in the presence of NK cells. After 2.5 days, proliferation of T cells was determined by flow cytometry as a reduction in CFSE labeling of CD8β+ T cells. (B) A representative result of four independent experiments is shown as mean ± SEM. (C, D) CFSE-labeled OT-I T cells were cocultured for 2.5 days with P815/tOVA cells and either BM-DCs (C) or splenic DCs (D) in the presence of NK cells from B6, PFP−/− or Trail−/− mice. (E) CFSE-labeled OT-I T cells were cocultured for 2.5 days with splenic DCs and P815/tOVA cells or the cells expressing TRAIL. (F) CFSE-labeled OT-I T cells were cocultured for 2.5 days with P815/tOVA cells and splenic DCs from B6 or DR5−/− mice in the presence of NK cells. Numbers represent normalized percentage of proliferating T cells (no NK = 100%). Cumulative data from three independent experiments are shown as mean ± SEM. *, p < 0.05; **, p < 0.01; ***, p < 0.001.
FIGURE 3
FIGURE 3. NK cells inhibit DC-mediated MHC class II-restricted priming of CD4+ T cells with tumor antigens but not soluble antigens
CFSE-labeled OVA-specific OT-II (CD4+, I-Ab restricted) T cells were cocultured with splenic DCs and (A) γ-ray irradiated tumor cells (P815/t-OVA), or (B), soluble OVA protein (100 μg/ml). After 2.5 days, proliferation of CD4+ T cells was determined by flow cytometry. Numbers represent normalized percentage of proliferating T cells (no NK = 100%). Cumulative data from three independent experiments are shown as mean ± SEM. * p < 0.05.
FIGURE 4
FIGURE 4. NK cells do not inhibit DC direct priming
(A & B) CFSE-labeled H-Y-specific T cells were co-cultured with male splenic DCs for 2.5 days in the presence of NK cells (2–50 × 103). Percentage (A) or MFI (B) of proliferating T cells (gated on CD8β+ cells) is shown as mean ± SEM of triplicates. (C) OVA peptide (SIINFEKL, 10−10–10−12 M)-pulsed BM-DCs (2 × 10⁴) were co-cultured with CFSE-labeled OT-I T cells (5 × 10⁴) for 2.5 days in the presence or absence of NK cells (2–50 × 103/well). Numbers represent percentage of proliferating T cells. A representative result of two independent experiments is shown as mean ± SEM of triplicates. (D) CD11c+ BM-DCs (5 × 10⁵) were cultured for 24 hr in control mAbs or anti-DR5 mAbs-coated 24-well plates or in control wells (PBS). The cells (2 × 10⁴) were pulsed with OVA peptide (10−10–10−12 M), and then co-cultured with CFSE-labeled OT-I T cells. Proliferation of CD8β+ T cells was determined by flow cytometry. Cumulative data from three independent experiments are shown as mean ± SEM.
FIGURE 5
FIGURE 5. Resting NK cells do not kill tumor cells or DCs
A, Splenocytes from RAG-I−/− mice were incubated with or without IL-4 (1,000 U) for 4 days, and then cocultured with P815/tOVA cells or YAC-1 cells at ratios from 1:1 to 25:1 in 5-h 51Cr release assays. Cumulative data from three independent experiments are shown as mean ± SEM. B, primary non-activated NK cells do not induce cell death of DCs. DCs (BM-DCs, 5×10⁴) alone or NK (105) plus DCs were cultured in 96-well plates for either 24 hr or 48 hr before annexin V and PI staining. The data shown are gated on DCs (APC-anti-CD11c+). As positive control, 5% EtOH was added 24h before cell staining. A representative result of two independent experiments is shown as mean ± SEM of triplicates.
FIGURE 6
FIGURE 6. DC Cross-priming of tumor cells is inhibited by cross-linking with anti-DR5 mAbs
(A) CD11c+ BM-DCs (5 × 10⁵) were cultured for 24 hr in control mAbs or anti-DR5 mAbs-coated 24-well plates or in control wells (PBS). The DCs (2 × 10⁴) were then cocultured for 4 days with CFSE-labeled OVA-specfic OT-I T cells (5 × 10⁴) and P815/tOVA cells (2 × 10⁴). Numbers represent percentage of proliferating T cells. A representative result of four independent experiments is shown as mean ± SEM of triplicate. (B) BM-DCs (5 × 10⁴) were cultured for 24 hr in control mAbs or anti-DR5 mAbs-coated 96-well plates and then incubated with P815/tOVA cells (5 × 10⁴, PKH26+). Percentages refer to PKH26+ cells within the CD11c+ gated cells (DCs). The MFI of PKH26 (C, E) and percentages of PKH26 positive DCs (D) are indicated for each time point (30 min, 1 hr and 4 hr). Cumulative data from three independent experiments are shown as mean ± SEM. Wt (F) or DR5−/− (G) BM-DCs alone or DCs with tumor cells were cocultured for 24 h before staining with 25-D1.16 and anti-CD11c-mAbs. A representative result of two independent experiments is shown as mean ± SEM of triplicates. *, p < 0.05; ***, p < 0.001.
FIGURE 7
FIGURE 7. DR5 cross-linking did not inhibit DC cross-priming of soluble OVA and OVA-coupled latex beads
(A) CD11c+ BM-DCs (5 × 10⁵) were cultured in control mAbs or anti-DR5 mAbs-coated 24-well plates or in control wells (PBS). The cells (2 × 10⁴) were then cocultured for 2.5 days with indicated dose of soluble OVA protein and CFSE-labeled OT-I T cells (5 × 10⁴). (B) OVA-coupled beads were cocultured for 4 days with the DCs and CFSE-labeled OT-I T cells. Numbers represent percentage of proliferating CD8β+ T cells. Cumulative data from two independent experiments are shown as mean ± SEM.
FIGURE 8
FIGURE 8. Ariginase-1 is involved in DR5-mediated inhibition of DC cross-priming
(A) CD11c+ BM-DCs (5 × 10⁴) were cultured for 4 hr and 24 hr in control mAbs or anti-DR5 mAbs-coated 96-well plates or in control wells (PBS). The expression of indicated genes were quantified by real-time RT-PCR (PBS at 4 hr = 1). Cumulative data from two independent experiments are shown as mean ± SEM. (B) CFSE-labeled OVA-specific OT-I T cells were cocultured with control mAbs- or anti-DR5 mAbs-cross-linked BM-DCs and γ-ray irradiated P815/tOVA in the presence of inhibitors, including 50 μM L-NIL, 50 μM nor-NOHA, 200 μM 1-MT, media control, or in the presence of blocking mAbs against IL-10 (10 μg/ml) or control mAbs. After 4 days, proliferation of CD8β+ T cells was determined by flow cytometry (Media or IgG2a = 100%). Cumulative data from three independent experiments are shown as mean ± SEM. *, p < 0.05; **, p < 0.01; ***, p < 0.001.
FIGURE 9
FIGURE 9. Summary of NK cell-mediated effects on Ag presentation by DCs
NK cell effects on presentation of peptides, soluble proteins, and tumor cells has been evaluated. Key molecules involved in cross-presentation are indicated (Tap, Derlin, Sec61 and proteasome). The pathways inhibited by NK cells are indicated as red arrows “Inh”, and non-altered pathways as black arrows “OK”. MHC class I is indicated as “I”, and MHC class II as “II”. The exact location of proteins and vesicles are only approximate, and they are meant to show general pathways. See text for details.

References

    1. Lanier LL. NK cell recognition. Annu Rev Immunol. 2005;23:225–274. - PubMed
    1. Degli-Esposti MA, Smyth MJ. Close encounters of different kinds: dendritic cells and NK cells take centre stage. Nat Rev Immunol. 2005;5:112–124. - PubMed
    1. Walzer T, Dalod M, Robbins SH, Zitvogel L, Vivier E. Natural-killer cells and dendritic cells: “l’union fait la force”. Blood. 2005;106:2252–2258. - PubMed
    1. Tacken PJ, I, de Vries J, Torensma R, Figdor CG. Dendritic-cell immunotherapy: from ex vivo loading to in vivo targeting. Nat Rev Immunol. 2007;7:790–802. - PubMed
    1. Shen L, Rock KL. Priming of T cells by exogenous antigen cross-presented on MHC class I molecules. Curr Opin Immunol. 2006;18:85–91. - PubMed

Publication types

MeSH terms

Substances