Comparative Study
. 2011 Aug 10;31(32):11697-705.
doi: 10.1523/JNEUROSCI.1113-11.2011.

Nuclear factor κB-dependent neurite remodeling is mediated by Notch pathway

Affiliations
Comparative Study

Nuclear factor κB-dependent neurite remodeling is mediated by Notch pathway

Sara Anna Bonini et al. J Neurosci. .

Abstract

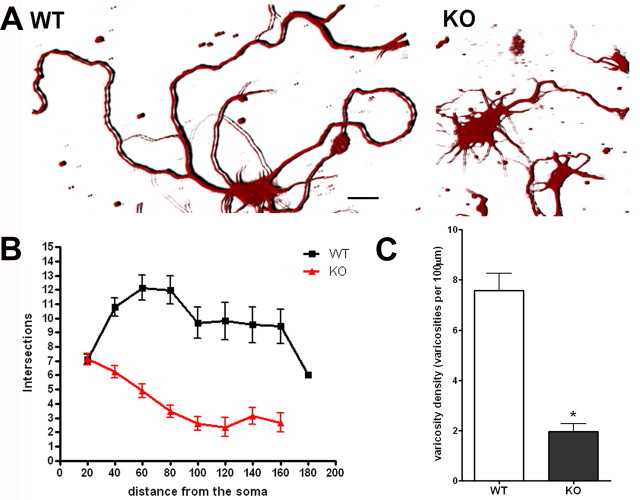
In this study, we evaluated whether a cross talk between nuclear factor κB (NF-κB) and Notch may take place and contribute to regulate cell morphology and/or neuronal network in primary cortical neurons. We found that lack of p50, either induced acutely by inhibiting p50 nuclear translocation or genetically in p50(-/-) mice, results in cortical neurons characterized by reduced neurite branching, loss of varicosities, and Notch1 signaling hyperactivation. The neuronal morphological effects found in p50(-/-) cortical cells were reversed after treatment with the γ-secretase inhibitor DAPT (N-[N-(3,5-difluorophenacetyl)-1-alanyl 1]-S-phenylglycine t-butyl ester) or Notch RNA interference. Together, these data suggested that morphological abnormalities in p50(-/-) cortical neurons were dependent on Notch pathway hyperactivation, with Notch ligand Jagged1 being a major player in mediating such effect. In this line, we demonstrated that the p50 subunit acts as transcriptional repressor of Jagged1. We also found altered distribution of Notch1 and Jagged1 immunoreactivity in the cortex of p50(-/-) mice compared with wild-type littermates at postnatal day 1. These data suggest the relevance of future studies on the role of Notch/NF-κB cross talk in regulating cortex structural plasticity in physiological and pathological conditions.


Figures

Figure 1.
Figure 1.
Neurite branching and varicosities are reduced in p50−/− cortical neurons. Reduced complexity and varicosity density of neuronal processes in p50−/− (KO) compared with wild-type (WT) cortical cells. A, Representative 3D images of cortical neurons from WT (left) and KO mice (right) stained with anti-βIII-Tubulin antibody. Scale bar, 20 μm. B, Graphic representation of branching quantification performed using the Sholl profile analysis. Data are expressed as mean ± SEM. C, Quantification of varicosity loss in KO neurons compared with WT. Varicosity density was measured counting the number of varicosities in 100 μm neurite length. Data are expressed as mean ± SEM. *p < 0.0001.
Figure 2.
Figure 2.
Notch1 pathway is upregulated in p50−/− cortical cells. Q-RT-PCR was performed using RNA extracted from WT and KO cortical cells to evaluate Notch1, Jagged1, and HES1 expression levels. Data are expressed as fold change of target gene expression in WT and KO cortical cells, normalized to the internal control gene (GAPDH). Data were analyzed according to the comparative Ct method.
Figure 3.
Figure 3.
Notch1 protein expression levels are increased in p50−/− cortical cells. A, Representative confocal images of cortical cells stained with anti-βIII-Tubulin (green) and anti-Notch1 (red) antibodies. Pictures show an increase of Notch1-positive staining in KO compared with WT cortical cells. Scale bar, 20 μm. B, Quantification of Notch1 immunostaining fluorescence intensity. Values are expressed as percentage of mean fluorescence intensity (% mean ± SEM) and are from at least 40 cellular fields. *p < 0.001 versus WT. C, Representative immunoblot of WT and KO cortical cell lysates using an anti-Notch1 antibody. Graph: Densitometric analysis of NICD levels measured by Western blot in WT and KO cortical cells. Data are normalized to the GAPDH signal, expressed as mean ± SEM, and are obtained from three experiments run with two different cell preparations. *p < 0.01.
Figure 4.
Figure 4.
Jagged1 protein expression levels are increased in p50−/− cortical cells. A, Representative confocal images of cortical cells stained with anti-βIII-Tubulin (red) and anti-Jagged1 (green) antibodies. Pictures show increased Jagged1 immunostaining in KO compared with WT cortical cells. Scale bar, 20 μm. B, Quantification of Jagged1 immunostaining fluorescence intensity. Values are expressed as percentage of mean fluorescence intensity (% mean ± SEM) and are from at least 40 cellular fields. *p < 0.001. C, Representative immunoblot of cortical cell lysates obtained from WT and KO mice using an anti-Jagged1 antibody. Graph: Densitometric analysis of Jagged1 levels measured by Western blot in WT and KO cortical cells. Data are normalized to the GAPDH signal, expressed as mean ± SEM, and are obtained from three experiments run with two different cell preparations. *p < 0.0001.
Figure 5.
Figure 5.
Notch1 blockade restores neurite branching and varicosities in p50−/− cortical neurons. A, Representative confocal images of cortical cells stained with anti-βIII-Tubulin antibody (red), DAPI (blue), and anti-Notch1 antibody (green). KO cortical neurons were exposed to the γ-secretase inhibitor DAPT, the siRNA NOTCH, or the scrambled siRNA probe (siRNA−) for 72 h. Scale bar, 20 μm. B, Quantification of varicosity density in WT and KO neurons after different treatments, as indicated. Varicosity density was measured counting number of varicosities in 100 μm neurite length. Data are expressed as mean ± SEM. *p < 0.001 versus KO. C, Graphic representation of branching quantification performed using the Sholl profile analysis in WT and KO neurons after different treatments, as indicated. Data are expressed as mean ± SEM.
Figure 6.
Figure 6.
Acute NF-κB signaling manipulation induces Jagged1 upregulation and morphological changes. A, Q-RT-PCR was performed on cDNA from WT cortical cells after 10 μm SN-50 or SN-50 mut treatment at 48 h. Data are presented as fold change of target gene expression normalized to the internal control gene (GAPDH). Data were analyzed according to the comparative Ct method. SN-50 treatment resulted in an upregulation of Jagged1 mRNA expression compared with the vehicle-treated cells (CTR). An SN-50 mutant peptide (SN-50 mut) was used to validate SN-50 specificity. B, Graphic representation of branching quantification performed using the Sholl profile analysis in WT neurons after SN-50 treatment. Data are expressed as mean ± SEM. C, ChIP experiments were performed with anti-p50 and anti-p65 antibodies on WT cortical neurons treated with 10 ng/ml TNF-α for 24 h or 10 μm SN-50 for 48 h. PCR analysis was performed on the immunoprecipitated DNA samples using specific primers for the Jagged1 promoter. A sample representing linear amplification of the total input chromatin (Input) was included as control. Additional controls included immunoprecipitation performed with nonspecific Igs (no Ab). Amplification of 36B4 housekeeping gene was used as control of p50 and p65 binding specificity to the Jagged1 promoter. D, Q-RT-PCR was performed on cDNA from WT cortical cells after 24 h of TNF-α treatment (10 ng/ml). Data are presented as fold change of target gene expression normalized to the internal control gene (GAPDH). Data were analyzed according to the comparative Ct method. TNF-α treatment resulted in an upregulation of Jagged1 mRNA expression compared with the vehicle-treated cells (CTR).
Figure 7.
Figure 7.
In vivo increase of Notch1- and Jagged1-positive neurons in p50−/− mouse cortex. Representative confocal images of cerebral cortex from P1 WT and KO mouse brain sections stained with anti-Notch1 (red) or anti-Jagged1 (red) antibody and DAPI (blue). Inset, Scheme of a P1 mouse brain section, with the indication (red mark) of the region of interest. A, Top panel, Representative images of WT cortex with Notch1-positive neurons localized mainly in the basal layer and few Notch1-stained cells in the upper cortical layers (arrows). Bottom panel, Representative images of KO mouse cortex with Notch1-expressing neurons both in the basal cortical layer and in the whole cortical stratifications (arrows). B, Top panel, Representative images of WT cortex with Jagged1-positive neurons localized in the basal layer. Bottom panel, Representative images of KO mouse cortex with Jagged1-expressing neurons that exceed the basal layer and spread through other cortical layers. WM, White matter. Scale bar, 20 μm.

References

    1. Ables JL, Breunig JJ, Eisch AJ, Rakic P. Not(ch) just development: Notch signalling in the adult brain. Nat Rev Neurosci. 2011;12:269–283. - PMC - PubMed
    1. Akimoto M, Kameda Y, Arai Y, Miura M, Nishimaki T, Takeda A, Uchinuma E. HES1 is required for the development of craniofacial structures derived from ectomesenchymal neural crest cells. J Craniofac Surg. 2010;21:1443–1449. - PubMed
    1. Albensi BC, Mattson MP. Evidence for the involvement of TNF and NF-κB in hippocampal synaptic plasticity. Synapse. 2000;35:151–159. - PubMed
    1. Ang HL, Tergaonkar V. Notch and NF-κB signaling pathways: do they collaborate in normal vertebrate brain development and function? Bioessays. 2007;29:1039–1047. - PubMed
    1. Artavanis-Tsakonas S, Delidakis C, Fehon R, Hartley D, Herndon D, Johansen K, Markopoulou K, Preiss A, Rebay I, Scottgale N. Notch and the molecular genetics of neuroblast segregation in Drosophila. Mol Reprod Rev. 1990;27:23–27. - PubMed

Publication types

LinkOut - more resources