Comparative Study
. 2011 Aug 10;31(32):11718-27.
doi: 10.1523/JNEUROSCI.1098-11.2011.

Degeneracy and neuromodulation among thermosensory neurons contribute to robust thermosensory behaviors in Caenorhabditis elegans

Affiliations
Comparative Study

Degeneracy and neuromodulation among thermosensory neurons contribute to robust thermosensory behaviors in Caenorhabditis elegans

Matthew Beverly et al. J Neurosci. .

Abstract

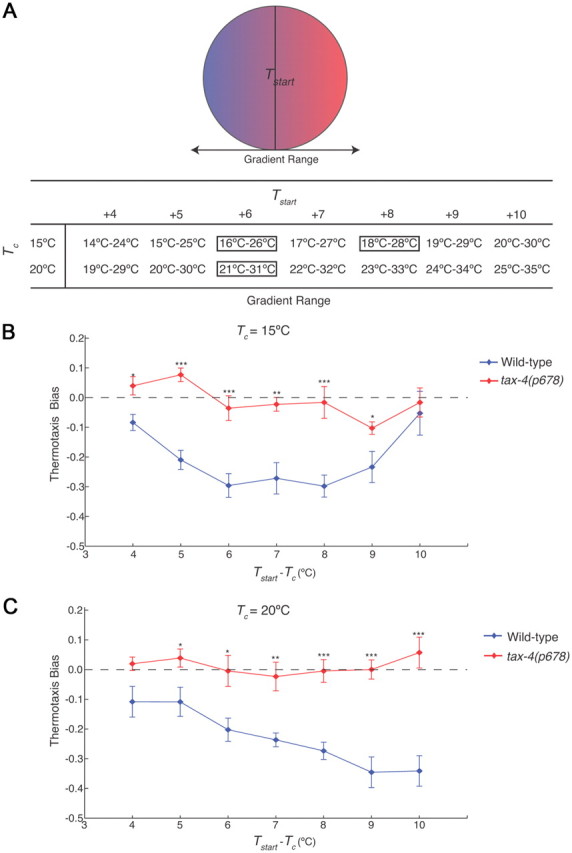
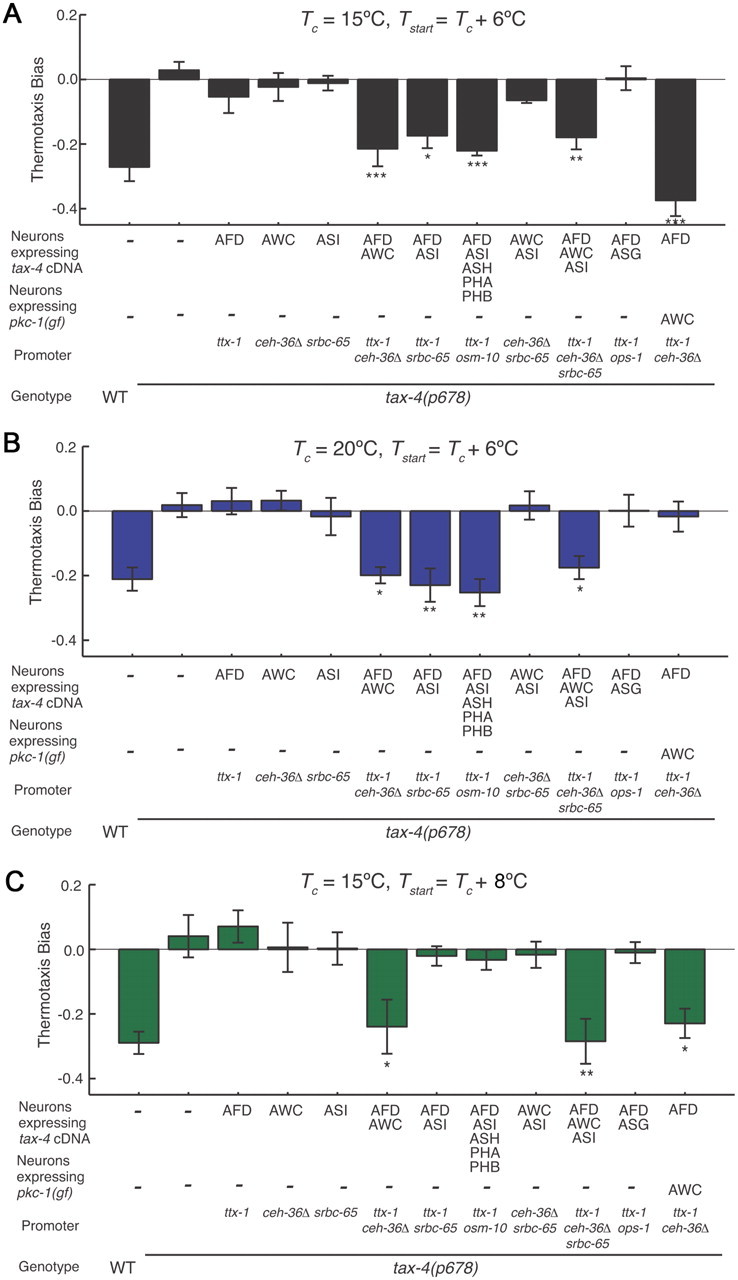
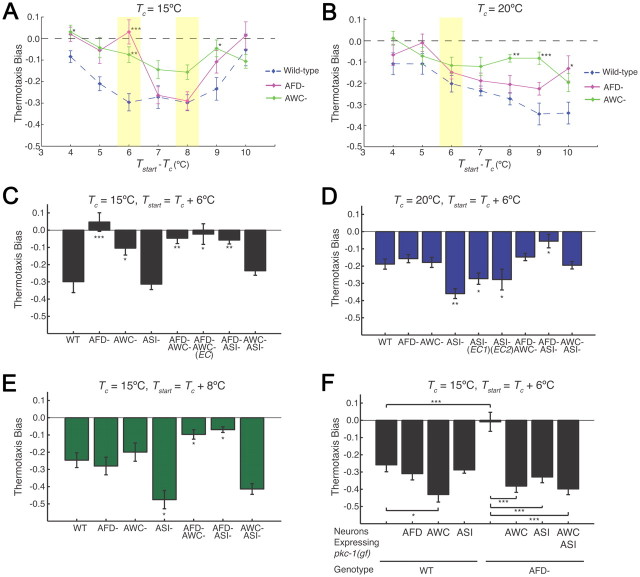
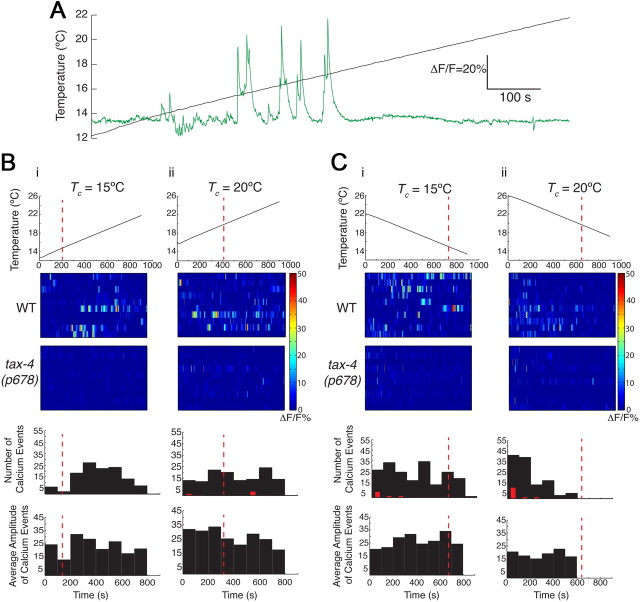
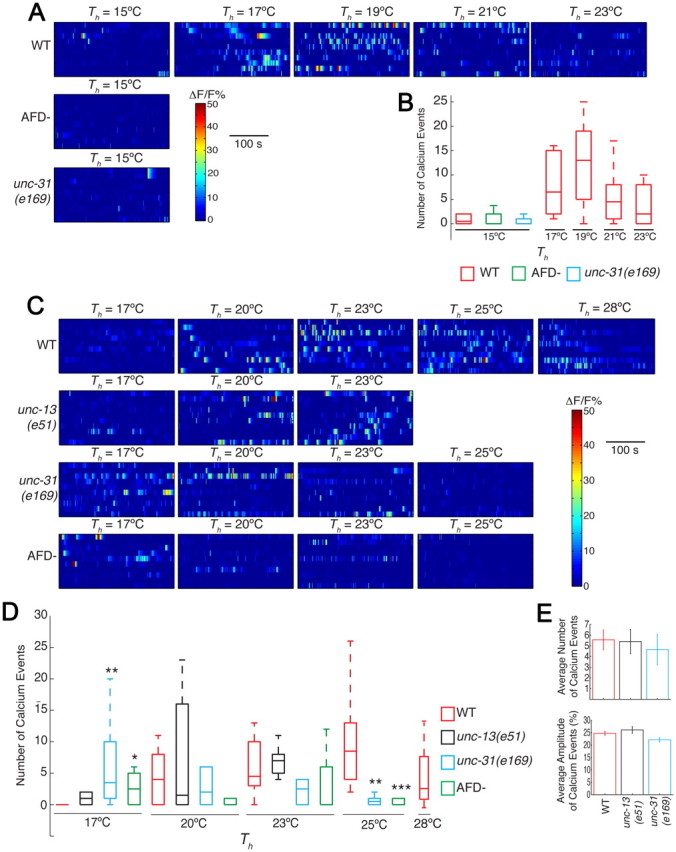
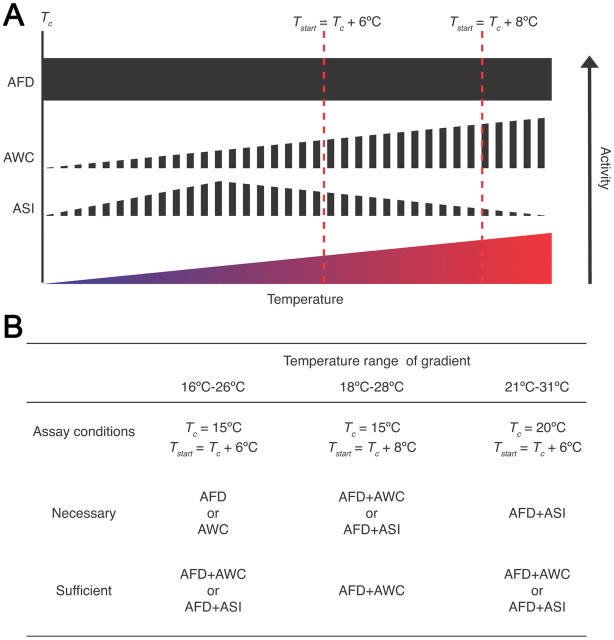
Animals must ensure that they can execute behaviors important for physiological homeostasis under constantly changing environmental conditions. The neural mechanisms that regulate this behavioral robustness are not well understood. The nematode Caenorhabditis elegans thermoregulates primarily via modulation of navigation behavior. Upon encountering temperatures higher than its cultivation temperature (T(c)), C. elegans exhibits negative thermotaxis toward colder temperatures using a biased random walk strategy. We find that C. elegans exhibits robust negative thermotaxis bias under conditions of varying T(c) and temperature ranges. By cell ablation and cell-specific rescue experiments, we show that the ASI chemosensory neurons are newly identified components of the thermosensory circuit, and that different combinations of ASI and the previously identified AFD and AWC thermosensory neurons are necessary and sufficient under different conditions to execute a negative thermotaxis strategy. ASI responds to temperature stimuli within a defined operating range defined by T(c), and signaling from AFD regulates the bounds of this operating range, suggesting that neuromodulation among thermosensory neurons maintains coherence of behavioral output. Our observations demonstrate that a negative thermotaxis navigational strategy can be generated via different combinations of thermosensory neurons acting degenerately, and emphasize the importance of defining context when analyzing neuronal contributions to a behavior.


Figures

Figure 1.
Figure 1.
C. elegans exhibits robust negative thermotaxis bias under varying conditions. A, Diagram of assay conditions. Gradient steepness was maintained at 1.0°C/cm. Animals were placed in the middle of the gradient at the start of the assay (Tstart). The temperature ranges of the gradient for varying cultivation temperatures (Tc) and Tstart are shown. Conditions examined further in this study are boxed. B, C, Thermotaxis bias (see text) exhibited by wild-type and tax-4(p678) animals for Tc = 15°C (B) or Tc = 20°C (C) with varying Tstart. For each data point, n = 105 animals; 7 independent assays. Error bars are the SEM. *, **, and *** indicate significant differences from wild-type values at p < 0.05, p < 0.01, and p < 0.001, respectively, by one-way ANOVA.
Figure 2.
Figure 2.
Different sensory neuron subsets are sufficient to restore negative thermotaxis bias to tax-4 mutants under different conditions. A–C, Thermotaxis bias of transgenic tax-4(p678) mutants expressing wild-type tax-4 cDNA under the indicated cell-specific promoters (also see Materials and Methods). Conditions for each assay are indicated above each panel. Values shown are from one transgenic line for each construct; additional transgenic lines showed similar behaviors. For each data point, n = 105 animals; 7 independent assays. *, **, and *** indicate significant differences from tax-4 values at p < 0.05, p < 0.01, and p < 0.001, respectively, by one-way ANOVA with Bonferroni post hoc correction. Error bars are the SEM.
Figure 3.
Figure 3.
The AFD, AWC, and ASI neurons are required in a degenerate manner to generate negative thermotaxis bias under different conditions. A, B, Thermotaxis bias of wild-type and neuron-ablated strains (see Materials and Methods) under the indicated conditions. Wild-type data from Figure 1 are included for comparison. Data from wild-type, tax-4, and neuron-ablated strains shown in Figures 1B, 1C, 3A, and 3B were obtained together on multiple days. For each data point, n = 105 animals; 7 independent assays. *, **, and *** indicate significant differences from wild-type values at p < 0.05, p < 0.01, and p < 0.001, respectively, by one-way ANOVA with Bonferroni post hoc correction. Conditions examined further are shaded. C–E, Thermotaxis bias of indicated strains under the specified conditions. EC indicates that the promoter::caspase constructs were driven under different promoter combinations and present as extrachromosomal arrays (see Materials and Methods). n = 105 animals; 7 independent assays. *, **, and *** indicate significant differences from wild-type values at p < 0.05, p < 0.01, and p < 0.001, respectively, by one-way ANOVA with Bonferroni post hoc correction. Error bars are the SEM. Average speeds (in millimeters per second) of strains were as follows: (Tc = 15°C) wild-type—0.17 ± 0.008, AFD-ablated—0.13 ± 0.002, AWC-ablated—0.17 ± 0.007, ASI-ablated—0.15 ± 0.005; (Tc = 20°C) wild-type—0.18 ± 0.005, AFD-ablated—0.14 ± 0.004, AWC-ablated—0.20 ± 0.003, ASI-ablated—0.15 ± 0.004. F, Thermotaxis bias of wild-type or AFD-ablated strains expressing pkc-1(gf) under cell-specific promoters from extrachromosomal arrays. Numbers shown are from one transgenic line each. n = 105 animals; 7 independent assays. * and *** indicate significant differences at p < 0.05 and p < 0.001, respectively, between values indicated by brackets (one-way ANOVA with Bonferroni post hoc correction). Error bars are the SEM.
Figure 4.
Figure 4.
The ASI neurons exhibit intracellular changes in Ca2+ dynamics in response to temperature changes. A, Representative example of a rising temperature stimulus (black) and Ca2+ events (green) in an ASI neuron expressing GCaMP 2.2. Tc = 15°C. B, C, Heat maps and histograms showing responses of individual ASI neurons in wild-type or tax-4 mutants to a linear upward (B) or downward (C) temperature ramp at the indicated Tc. The slope of the ramps was 0.01°C/s. Each line in the heat maps represents the responses of one neuron. Red dotted lines indicate Tc. Red bars indicate number of observed Ca2+ events in tax-4 mutants; responses are different at p < 0.001 (Bi) and p < 0.01 (Bii, Ci, Cii) compared to wild-type values using a Kruskal–Wallis nonparametric test. Amplitudes of events in tax-4 mutants are not shown. A fluorescence change of >10% was considered a response. n = 10 neurons each.
Figure 5.
Figure 5.
The operating range of ASI may be regulated by AFD-mediated neuromodulation. A, C, Heat maps of responses of individual ASI neurons upon temperature shifts. Tc = 15°C (A) or 20°C (C). Th indicates the holding temperature at which responses were quantified. B, D, Box-and-whisker plots of the frequency range of Ca2+ events upon temperature shifts to Th in the indicated genetic backgrounds. For this quantification, a fluorescence change of >10% was considered a response. Boxes indicate the 25th (lower boundary), 50th (median indicated by a line), and 75th (upper boundary) percentiles. Whiskers show the minimum and maximum numbers of events. *, **, and *** indicate values that are different at p < 0.05, 0.01, and 0.001, respectively, from the corresponding wild-type values using the Kruskal–Wallis nonparametric test. n = 10 neurons for each data point. E, Average response frequencies and amplitudes of wild-type and unc-13(e51) and unc-31(e169) mutants at Tc = 20°C. Averages are calculated from data shown in C.
Figure 6.
Figure 6.
Necessity and sufficiency of distinct subsets of thermosensory neurons under different conditions. A, Shown are the inferred activity levels of AFD, AWC, and ASI at different temperatures above Tc (Kimura et al., 2004; Chung et al., 2006; Biron et al., 2008; Kuhara et al., 2008; Ramot et al., 2008a). Filled and striped boxes indicate deterministic and stochastic Ca2+ events in response to temperature, respectively. All temperatures above Tc have not yet been systematically tested for AFD and AWC. B, Neurons shown to be necessary and/or sufficient for negative thermotaxis bias are indicated below for each examined condition and gradient temperature range.

Comment in

References

    1. Ailion M, Thomas JH. Dauer formation induced by high temperatures in Caenorhabditis elegans. Genetics. 2000;156:1047–1067. - PMC - PubMed
    1. Anderson JL, Albergotti L, Proulx S, Peden C, Huey RB, Phillips PC. Thermal preference of Caenorhabditis elegans: a null model and empirical tests. J Exp Biol. 2007;210:3107–3116. - PubMed
    1. Ann K, Kowalchyk JA, Loyet KM, Martin TF. Novel Ca2+-binding protein (CAPS) related to UNC-31 required for Ca2+-activated exocytosis. J Biol Chem. 1997;272:19637–19640. - PubMed
    1. Bargmann CI, Horvitz HR. Control of larval development by chemosensory neurons in Caenorhabditis elegans. Science. 1991;251:1243–1246. - PubMed
    1. Bargmann CI, Hartwieg E, Horvitz HR. Odorant-selective genes and neurons mediate olfaction in C. elegans. Cell. 1993;74:515–527. - PubMed

Publication types

MeSH terms

LinkOut - more resources