

The natural history of spinocerebellar ataxia type 1, 2, 3, and 6: a 2-year follow-up study
- PMID: 21832228
- PMCID: PMC3174068
- DOI: 10.1212/WNL.0b013e31822e7ca0
The natural history of spinocerebellar ataxia type 1, 2, 3, and 6: a 2-year follow-up study
Abstract
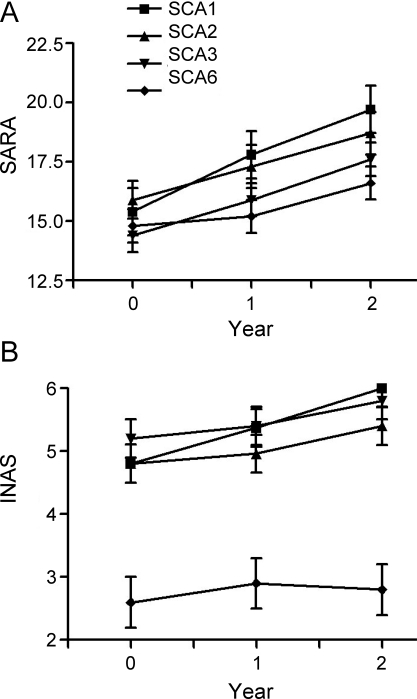
Objective: To obtain quantitative data on the progression of the most common spinocerebellar ataxias (SCAs) and identify factors that influence their progression, we initiated the EUROSCA natural history study, a multicentric longitudinal cohort study of 526 patients with SCA1, SCA2, SCA3, or SCA6. We report the results of the 1- and 2-year follow-up visits.
Methods: As the primary outcome measure we used the Scale for the Assessment and Rating of Ataxia (SARA, 0-40), and as a secondary measure the Inventory of Non-Ataxia Symptoms (INAS, 0-16) count.
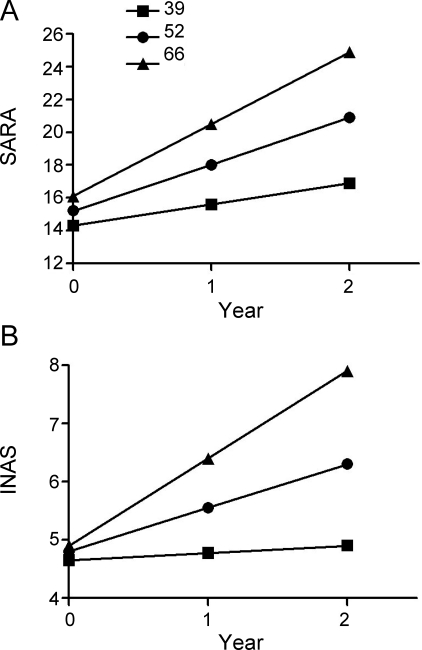
Results: The annual increase of the SARA score was greatest in SCA1 (2.18 ± 0.17, mean ± SE) followed by SCA3 (1.61 ± 0.12) and SCA2 (1.40 ± 0.11). SARA progression in SCA6 was slowest and nonlinear (first year: 0.35 ± 0.34, second year: 1.44 ± 0.34). Analysis of the INAS count yielded similar results. Larger expanded repeats and earlier age at onset were associated with faster SARA progression in SCA1 and SCA2. In SCA1, repeat length of the expanded allele had a similar effect on INAS progression. In SCA3, SARA progression was influenced by the disease duration at inclusion, and INAS progression was faster in females.
Conclusions: Our study gives a comprehensive quantitative account of disease progression in SCA1, SCA2, SCA3, and SCA6 and identifies factors that specifically affect disease progression.
Figures
Comment in
-
Progression rates of dominant spinocerebellar ataxias.Neurology. 2011 Sep 13;77(11):1026-7. doi: 10.1212/WNL.0b013e31822e14a7. Epub 2011 Aug 10. Neurology. 2011. PMID: 21832230 No abstract available.
References
-
- Schols L, Bauer P, Schmidt T, Schulte T, Riess O. Autosomal dominant cerebellar ataxias: clinical features, genetics, and pathogenesis. Lancet Neurol 2004; 3: 291– 304 - PubMed
-
- Riess O, Schöls L, Bottger H, et al. SCA6 is caused by moderate CAG expansion in the alpha1A-voltage-dependent calcium channel gene. Hum Mol Genet 1997; 6: 1289– 1293 - PubMed
-
- Pulst SM, Nechiporuk A, Nechiporuk T, et al. Moderate expansion of a normally biallelic trinucleotide repeat in spinocerebellar ataxia type 2. Nature Genet 1996; 14: 269– 276 - PubMed
-
- Imbert G, Saudou F, Yvert G, et al. Cloning of the gene for spinocerebellar ataxia 2 reveals a locus with high sensitivity to expanded CAG/glutamine repeats. Nature Genet 1996; 14: 285– 291 - PubMed
Publication types
MeSH terms
LinkOut - more resources
Full Text Sources
Other Literature Sources
Research Materials