. 2011 Aug 10;3(95):95ra74.
doi: 10.1126/scitranslmed.3002530.

Curaxins: anticancer compounds that simultaneously suppress NF-κB and activate p53 by targeting FACT

Affiliations

Curaxins: anticancer compounds that simultaneously suppress NF-κB and activate p53 by targeting FACT

Alexander V Gasparian et al. Sci Transl Med. .

Abstract

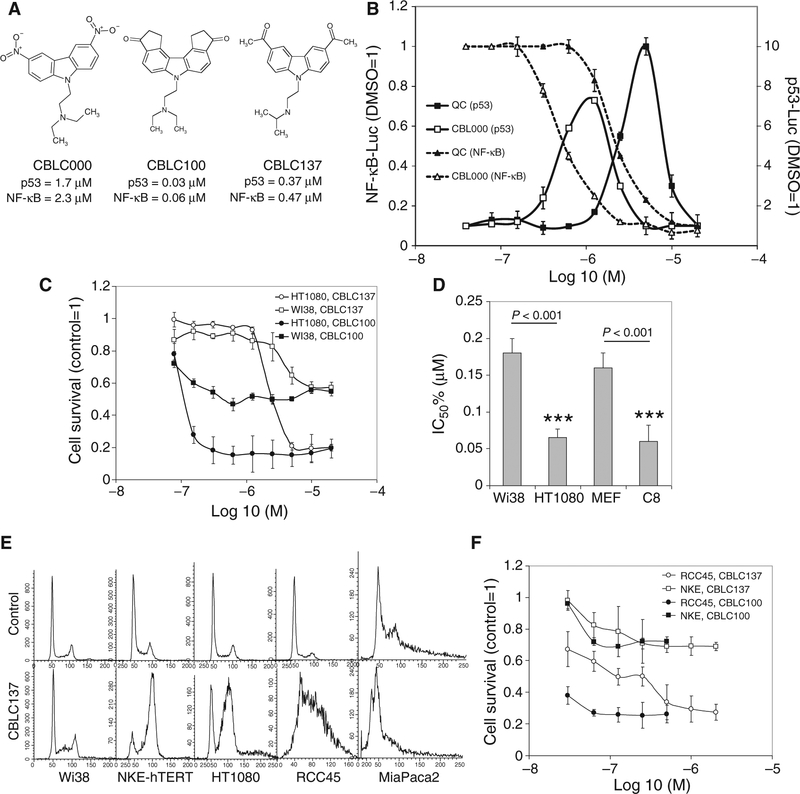
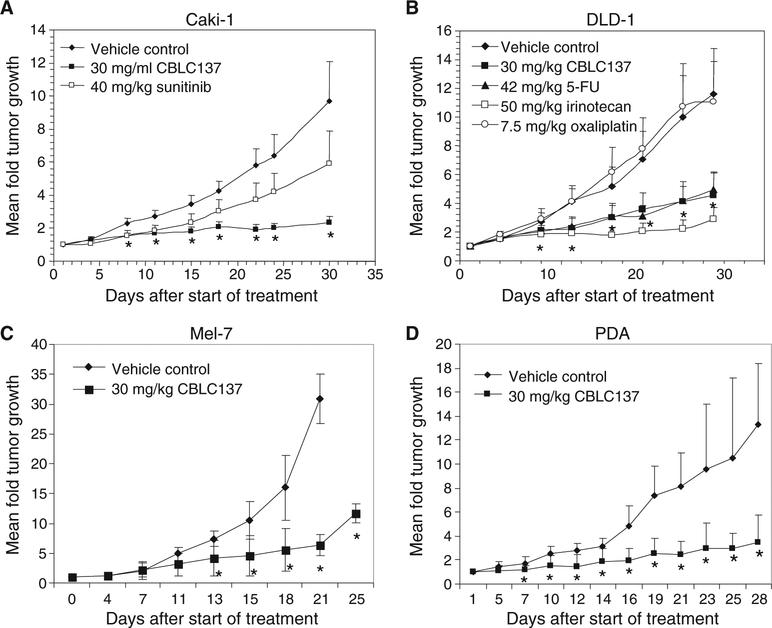
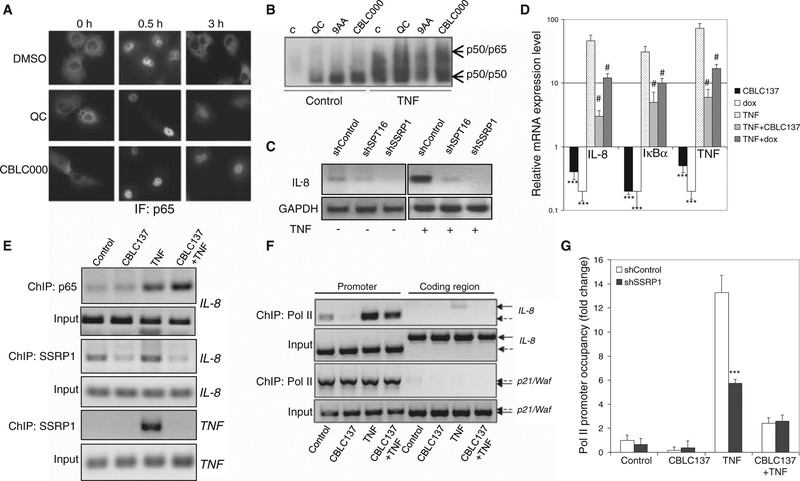
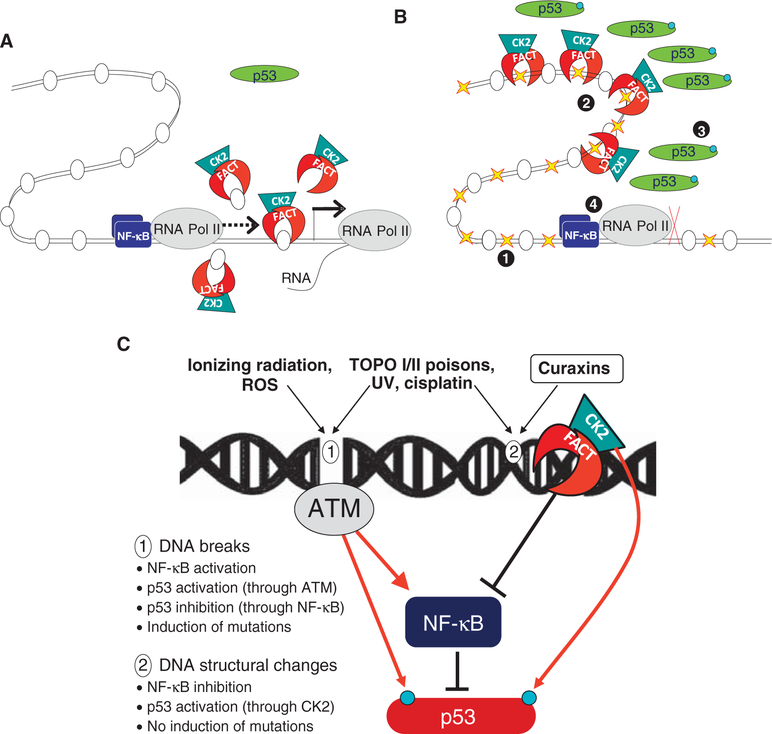
Effective eradication of cancer requires treatment directed against multiple targets. The p53 and nuclear factor κB (NF-κB) pathways are dysregulated in nearly all tumors, making them attractive targets for therapeutic activation and inhibition, respectively. We have isolated and structurally optimized small molecules, curaxins, that simultaneously activate p53 and inhibit NF-κB without causing detectable genotoxicity. Curaxins demonstrated anticancer activity against all tested human tumor xenografts grown in mice. We report here that the effects of curaxins on p53 and NF-κB, as well as their toxicity to cancer cells, result from "chromatin trapping" of the FACT (facilitates chromatin transcription) complex. This FACT inaccessibility leads to phosphorylation of the p53 Ser(392) by casein kinase 2 and inhibition of NF-κB-dependent transcription, which requires FACT activity at the elongation stage. These results identify FACT as a prospective anticancer target enabling simultaneous modulation of several pathways frequently dysregulated in cancer without induction of DNA damage. Curaxins have the potential to be developed into effective and safe anticancer drugs.


Conflict of interest statement

Competing interests: K.V.G., A.A.P., C.A.B., and A. V. Gudkov are co-inventors on a patent application that covers composition of matter and use of curaxins, #61/102,913, “Carbazole compounds and therapeutic uses of the compounds.” A. V. Gudkov is a paid consultant and has equity interest in Cleveland BioLabs Inc., which holds patents on and develops curaxins. O.A.G. has been a paid consultant for RPCI, and K.V.G. has received an honorarium from Incuron Inc. C.A.B. has stock options in Cleveland BioLabs Inc. The others authors declare no competing interests.

Figures

Fig. 1.
Fig. 1.
Structure and activity of curaxins. (A) Structural formulas of curaxins CBLC000, CBLC100, and CBLC137 with their EC50 in cell-based p53 and NF-κB reporter assays. (B) CBLC000 activates a p53-dependent reporter and inhibits an NF-κB–dependent reporter similarly to quinacrine (QC), but at lower concentrations (x axis). The fold change in luciferase reporter activity relative to 0.1% dimethyl sulfoxide (DMSO) treatment is shown (mean of three replicates ± SD). (C) Cytotoxicity of curaxins to cultured human diploid fibroblasts (Wi38) and fibrosarcoma (HT1080) cells (mean of three replicates ± SD). (D) Fifty percent inhibitory concentration (IC50%) of CBLC137 for human and mouse normal diploid fibroblasts (Wi38, MEF), HT1080 cells, and mouse-transformed fibroblasts [C8 (56)]. Error bars indicate 75% confidence intervals. ***P < 0.001, t test. (E) Effect of CBLC137 (2 μM for 24 hours) on cell cycle in tumor (HT1080, RCC45, MiaPaca) and normal cells (Wi38, NKE-hTERT); fluorescence-activated cell sorting (FACS) analysis of propidium iodide–stained cells. (F) Regrowth of RCC45 and NKE-hTERT cells after curaxin treatment for 3 hours. Methylene blue–stained cells were counted 5 days later. See also fig. S1.
Fig. 2.
Fig. 2.
Antitumor effect of curaxin CBLC137 in xenograft mouse models of cancer. (A to D) Renal cell carcinoma Caki-1 (A), colon carcinoma DLD-1 (B), melanoma Mel-7 (C), and pancreatic ductal adeno-carcinoma (PDA) (D). Data are mean fold change in tumor volume (5 to 10 mice per group) relative to day 1 of treatment ± SD. *P < 0.005 for comparison of CBLC137 and vehicle, analysis of variance (ANOVA) test. See also fig. S2.
Fig. 3.
Fig. 3.
Dependence of p53 activation by curaxin on CK2 and FACT. (A) Western analysis of HT1080 cells treated with quinacrine (6 μM), CBLC000 (2 μM), CBLC137 (0.8 μM), “inactive” curaxin-like molecules (10 μM), or doxorubicin (DX, 1 μM) for 8 hours with phosphospecific or “total” (D01) p53 antibodies. C, untreated control; arrow, p53 phosphorylated on Ser392; asterisk, nonspecific band used as loading control. (B and C) Effect of p53 Ser392 to alanine substitution (S392A) on curaxin-induced p53 activation. (B) Western analysis (anti-p53 D01 antibody) of HCT116-p53 null cells transduced with wild-type p53 (wt) or S15A or S392A mutant p53 and treated with CBLC137, quinacrine, or doxorubicin (1 μM) for 8 hours. (C) Quantification of data in (B) with ImageJ software. (D) Effect of chemical inhibitors of CK2 (CK2i, 50 μM) and DNA-PK (DNA-PKi, 25 μM) on CBLC000-induced p53-Luc reporter activation. Cells were treated with CBLC000 (1 μM) and inhibitors for 16 hours. Data are mean fold change ± SD. ***P < 0.001 (t test) compared with treatment with CBLC000. (E) Effect of CK2 inhibition on CBLC000-induced p53 Ser392 phosphorylation (Western blotting, three upper panels) and DNA binding (EMSA, lower panel). Extracts were prepared from HT1080 cells treated with CBLC000 (1 μM) and CK2i (in μM) for 16 hours. NS, nonspecific bands used as loading controls; p53BE, specific p53-binding element probe. (F) Phosphorylation of the C terminus of p53 by CK2 induced by curaxins and UV treatment. CK2β immunoprecipitated from lysates of HT1080 cells treated with quinacrine, CBLC100, or UV was used in in vitro kinase assays with a peptide substrate corresponding to the C terminus of p53 (amino acids 311 to 393). (G) Effect of siRNA-mediated knockdown of SSRP1 or CK2 on CBLC137-induced(0.6 μM, 8 hours) p53 activation in HT1080 cells. Western blots were probed with antibodies against the proteins indicated above each panel. See also fig. S3.
Fig. 4.
Fig. 4.
Curaxin induction of FACT-chromatin binding. (A) Disappearance of SSRP1 from the soluble protein fraction after curaxin treatment. Western analysis of soluble nuclear extracts from RCC45 cells treated with CBLC137 (top), quinacrine (middle), or CBLC100 (bottom) for different times (left panels) or with different doses for 1 hour (right). (B) Western detection of SSRP1 in total cell lysates and the soluble protein fraction of lysates from HT1080 cells treated with quinacrine (5 μM), CBLC137 (2 μM), or CBLC100 (0.2 μM) for 1 hour. C, untreated. (C) SSRP1 and SPT16 redistribution from the nucleoplasm to chromatin after curaxin treatment. Western blotting (upper four panels) and Coomassie staining (bottom panel) of nuclear extracts from HT1080 cells treated with CBLC100 (CX, 0.2 μM, 1 hour) prepared using a modified high-salt extraction method (54). Anti-p53 staining demonstrates the response of cells to curaxins. Histones H2, H3, and H4 remain associated with chromatin even after extraction with 2.5 M NaCl. (D) Western analysis (anti-HMGB1 and anti-SSRP1) of nuclear extracts prepared as in (C) from HT1080 cells treated with quinacrine (5 μM), CBLC100 (0.2 μM), or cisplatin (100 μg/ml) for 6 hours. (E) Fluorescence imaging of live nonfixed HT1080 cells cotransfected with GFP-tagged SSRP1 and RFP-tagged histone H2B expression constructs and treated with CBLC137 (2 μM, 15 min). (F) Curaxin-induced depletion of soluble SSRP1 and SPT16 in vivo. MMTV-neu transgenic mice with palpable spontaneous mammary tumors were given CBLC137 (100 mg/kg) or vehicle (water) by oral gavage. Western blotting with the indicated antibodies was performed on the soluble fraction of lysates prepared from tumors 24 hours after treatment. (G) Quantification of the Western data in (F) with ImageJ software. Data are mean fold change to control normalized to actin ± SD. *P < 0.05, t test. See also fig. S4.
Fig. 5.
Fig. 5.
Association between FACT levels and cell growth, sensitivity to curaxins, and tumor phenotype. (A) Colony formation of HT1080 cells transduced with the indicated shRNAs. Inset: Western blots show shRNA effects on target protein levels. Data are mean of three replicates ± SD. **P < 0.01; ***P < 0.001, t tests. (B) Increased cell sensitivity to curaxin, but not cisplatin, after FACT knockdown. Colonies formed by cells plated 72 hours after shRNA transduction and treated with CBLC137 (0.5 μM) or cisplatin (1 μg/ml) for 24 hours. The mean number of colonies relative to untreated cells transduced with the same shRNA is shown. **P < 0.01; ***P < 0.001, t tests. (C) Enrichment of cells with higher levels of SSRP1 during CBLC137 exposure. FACS detection of GFP-tagged SSRP1 expression in transduced HT1080 cells cultured in 0.3 μM CBLC137 for different time. (D) Quantification of data shown in (C). **P < 0.01; ***P < 0.001, t tests. (E) Western analysis of FACT subunit expression in total cell extracts from tissues of an MMTV-neu mouse with palpable tumors. The mouse had visible lung metastases (lane indicated “lung with mts”). (F) Western analysis of FACT subunit expression in different cultured human cell lines. See also fig. S5.
Fig. 6.
Fig. 6.
Effect of curaxins on NF-κB. (A) Slower reshuttling of NF-κB from the nucleus to the cytoplasm after TNF induction in cells treated with curaxins. Immunofluorescence (IF) staining of p65 in HT1080 cells treated with TNF (10 ng/ml, here and thereafter) in combination with 0.1% DMSO, quinacrine (6 μM), or CBLC000 (1 μM). (B) Effect of curaxins on nuclear accumulation and DNA binding of NF-κB under basal (“control”) and TNF-stimulated conditions. EMSA with 32P-labeled NF-κB consensus binding element and nuclear extracts from H1299 cells left untreated (C) or treated with quinacrine (10 μM), 9-aminoacridine (9AA) (10 μM), or CBLC000 (2 μM) for 2 hours with or without concurrent TNF stimulation. (C and D) Involvement of FACT in TNF-induced NF-κB–dependent transcription. (C) Reverse transcription–PCR (RT-PCR) analysis of IL-8 mRNA expression in shRNA-transduced HT1080 cells left untreated or treated with TNF for 2 hours. GAPDH, glyceraldehyde-3-phosphate dehydrogenase. (D) Real-time quantitative RT-PCR (qPCR) analysis of IL-8, IκBα, and TNF expression in HT1080-tet-ON-shSSRP1 cells treated with CBLC137 (2 μM, 2 hours), doxycycline (dox) (to induce shSSRP1 expression, 5 μg/ml, 48 hours), and/or TNF (2 hours). Mean mRNA levels in treated cells relative to control (±SD) are shown. ***P < 0.001 for comparison to untreated cells; #P < 0.001 (t test) for comparison to TNF-treated cells. The level of SSRP1 mRNA measured by qPCR was reduced fivefold after doxycycline-induced shSSRP1 expression. (E) Reduced presence of SSRP1 on promoters of NF-κB–dependent genes (IL-8 and TNF) after curaxin treatment. ChIP assays using α-SSRP1 or α-p65 were performed on HT1080 cells treated with CBLC137 (1 μM), TNF, or both for 2 hours. (F) Curaxin-mediated inhibition of NF-κB–dependent transcription at the stage of elongation. ChIP using α-RNA Pol II antibody on cells treated as in (E) followed by PCR with primers specific to the promoter or coding region of the IL-8 or p21/Waf genes (used as a control because no induction of p21 is observed after 2 hours of curaxin treatment). Solid and dashed arrows indicate PCR products corresponding to coding and promoter regions, respectively. (G) Reduced RNA Pol II presence on the IL-8 promoter after CBLC137- or shSSRP1-inducing treatment, but no further reduction after combined treatment. ChIP with α-RNA Pol II was performed on HT1080-tet-ON-shSSRP1 (or HT1080-tet-ON-shControl) cells treated with doxycycline for 48 hours and then with CBLC137, TNF, or both as described in (D) for 80 min. ChIP products were assessed by qPCR with IL-8 promoter-specific primers. Data are mean fold change in RNA Pol II binding to the IL-8 promoter relative to untreated shControl-expressing cells ± SD. ***P < 0.001 from shControl (t test). See also fig. S6.
Fig. 7.
Fig. 7.
Binding of curaxins to DNA without induction of detectable DNA damage. (A) Comet assays were performed on HeLa cells left untreated (control) or treated with DMSO (0.1%), CBLC120 (an inactive curaxin analog, 10 μM), quinacrine (10 μM), CBLC137 (2 μM), CBLC100(0.5 μM), or doxorubicin (0.5 μM) for 6 hours. The amount of DNA breaks is indicated by the mean tail moment of individual cells ± SD (n > 10). *P < 0.05 for comparison to control cells (Kruskal-Wallis one-way ANOVA on ranks). (B) Failure of curaxins to induce histone H2AX phosphorylation. Immunofluorescence staining of HT1080 cells treated with doxorubicin (0.5 μM), CBLC101 (an inactive curaxin analog, 10 μM), CBLC137 (1 μM), or CBLC100 (0.2 μM) for 6 hours. (C) Stimulatory effect of CBLC137 on in vitro binding of SSRP1 to chromatin. Chromatin purified from HeLa cells was incubated for 20 min with FLAG-tagged SSRP1 (100 ng) and/or CBLC137 (2 μM). Reactions were spun down and the soluble and chromatin-bound (pellet) fractions were assessed by anti-FLAG Western blotting. (D) Lack of CBLC137 effect on in vitro binding of FACT to nucleosomal DNA. Autoradiogram of 32P-labeled mononucleosomal DNA (N) incubated with recombinant FACT (10 pM each subunit) and/or CBLC137 (2 μM) for 20 min. N(2) and N(3), di- and trinucleosomes formed upon FACT addition; asterisk, smear induced upon CBLC137 addition. (E) Computer modeling of quinacrine (left panel; electron density model of DNA with stick model of quinacrine) and CBLC137 (right panel; space-filling model) binding to double-stranded DNA. (F) Inverse proportionality of curaxin DNA binding constants and EC50 for p53 reporter activation. See also fig. S7.
Fig. 8.
Fig. 8.
Proposed model of curaxins’ mechanism of activity (see details in the text). (A and B) FACT involved in transcription elongation on normal conditions (A) is trapped in chromatin in curaxin-treated cells (B). 1, curaxin binds DNA and changes chromatin architecture; 2, FACT is trapped in chromatin; 3, p53 is phosphorylated by CK2; 4, NF-κB transcription is blocked. (C) Two types of consequences of small-molecule DNA interactions. 1, DNA breaks result from ionizing radiation and reactive oxygen species (ROS) reaction with DNA; 2, Changes in DNA 3D structure caused by nonreactive intercalators such as curaxins. Inhibitors of topoisomerases or compounds causing covalent modifications of DNA may cause structural changes in DNA and breaks. Red arrow, effects leading to an increase in the activity or the targeted factor; black lines, effect leading to an inhibition of the activity of the targeted factor.

Comment in

  • Cancer drug discovery faces the FACT.
    Draetta GF, Depinho RA. Draetta GF, et al. Sci Transl Med. 2011 Aug 10;3(95):95ps34. doi: 10.1126/scitranslmed.3002822. Sci Transl Med. 2011. PMID: 21832237

References

    1. Burdak-Rothkamm S, Prise KM, New molecular targets in radiotherapy: DNA damage signalling and repair in targeted and non-targeted cells. Eur. J. Pharmacol 625, 151–155 (2009). - PMC - PubMed
    1. Darzynkiewicz Z, Traganos F, Wlodkowic D, Impaired DNA damage response—An Achilles’ heel sensitizing cancer to chemotherapy and radiotherapy. Eur. J. Pharmacol 625, 143–150 (2009). - PMC - PubMed
    1. Gurova K, New hopes from old drugs: Revisiting DNA-binding small molecules as anticancer agents. Future Oncol. 5, 1685–1704 (2009). - PMC - PubMed
    1. Kawanishi S, Hiraku Y, Amplification of anticancer drug-induced DNA damage and apoptosis by DNA-binding compounds. Curr. Med. Chem. Anticancer Agents 4, 415–419 (2004). - PubMed
    1. Gudkov AV, Gurova KV, Komarova EA, Inflammation and p53: A tale of two stresses. Genes Cancer 2, 503–516 (2011). - PMC - PubMed

Publication types

MeSH terms