. 2011 Oct 6;118(14):3890-900.
doi: 10.1182/blood-2011-05-357111. Epub 2011 Aug 10.

IL-12 selectively programs effector pathways that are stably expressed in human CD8+ effector memory T cells in vivo

Affiliations

IL-12 selectively programs effector pathways that are stably expressed in human CD8+ effector memory T cells in vivo

Fatema Z Chowdhury et al. Blood. .

Abstract

CD8(+) cytotoxic T lymphocytes play a major role in defense against intracellular pathogens, and their functions are specified by antigen recognition and innate cytokines. IL-12 and IFN-α/β are potent "signal 3" cytokines that are involved in both effector and memory cell development. Although the majority of effector cells are eliminated as inflammation resolves, some survive within the pool of memory cells and retain immediate effector function. In this study, we demonstrate that IL-12 instructs a unique program of effector cell differentiation that is distinct from IFN-α/β. Moreover, effector memory (T(EM)) cells within peripheral blood display many common attributes of cells differentiated in vitro in response to IL-12, including proinflammatory cytokine secretion and lytic activity. A pattern of IL-12-induced genes was identified that demarcate T(EM) from central memory cells, and the ontologies of these genes correlated precisely with their effector functions. Further, we uncovered a unique program of gene expression that was acutely regulated by IL-12 and reflected in stable gene expression patterns within T(EM), but not T central memory cells in vivo. Thus, this study directly links a selective set of IL-12-induced genes to the programming of effector functions within the stable population of human CD8(+) T(EM) cells in vivo.


Figures
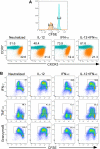
Figure 1
Figure 1
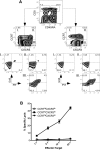
IL-12 programs CCR7loCXCR3hi effctor CD8+ T cells in vitro. (A) CD8+CD45RA+ T cells were labeled with CFSE and stimulated with plate-bound anti-CD3+anti-CD28 for 3 days in the presence of indicated cytokine conditions. On day 3, the cells were split 1:10 with 100 U/mL of rhIL-2. On day 4, cells were stained for CCR7 and CXCR3, and data are gated on the undivided CFSEhi (teal) and divided CFSElo (orange) populations. The percentage of each population is indicated within the dot plots. (B) Cytokine polarized CD8+ T cells (same as in panel A) were restimulated with 80 ng/mL of phorbol myristate acetate and 1μM of ionomycin in the presence of monensin for 4 hours. Cells were then fixed and stained for intracellular IFN-γ, TNF-α, and granzyme B.
Figure 2
Figure 2
CCR7loCXCR3hi CD8+ T cells display an effector phenotype. (A) PBMCs from healthy human blood were stained for surface receptors CD8, CD45RA, CXCR3, CCR7, and intracellular perforin and granzyme B. Four individual donors were used in replicate experiments, and representative plots from one experiment are shown. (B) Healthy human PBMCs were stained with antibodies specific for CD8, CCR7, and CXCR3 and sorted into 3 separate CD8+ populations as indicated in the figure. Redirected lysis assay was carried out at the indicated E:T ratios using anti–human anti-CD3–coated THP-1 target cells. The result was repeated with cells isolated from 2 healthy donor samples with similar results.
Figure 3
Figure 3
CCR7loCXCR3hi effector memory CD8+ T cells secrete effector cytokines. CCR7hiCXCR3lo, CCR7hiCXCR3hi, and CCR7loCXCR3hi CD8+ T cells were sorted from healthy human PBMCs and labeled with CFSE. The cells were stimulated with plate-bound anti-CD3 for 3 days in the absence or presence of 200 U/mL of rhIL-2. The cells were restimulated with phorbol myristate acetate and ionomycin in the presence of brefeldin A for 4 hours on day 3 after stimulation. Proliferation was measured by CFSE dilution, and IFN-γ was measured by intracellular staining. (B) The percentage of cells positive for IFN-γ expression as a function of cell division are plotted as mean ± SEM for the cells receiving exogenous IL-2 as indicated by the gates in panel A (far right dot plots). IFN-γ (C) and TNF-α (D) were measured in the supernatants by ELISA.
Figure 4
Figure 4
IL-12 and IFN-α regulate expression of unique gene sets in human CD8+ T cells. (A-B) Negatively isolated CD8+CD45RA+ T cells were polarized in vitro for 3 days under the defined conditions as indicated: neutralized (◊), IL-12 (■), IFN-α (○), and IL-12 + IFN-α (▴) and CFSElo (shown in orange in Figure 1A) and CFSEhi (shown in teal in Figure 1A) cells were sorted for RNA extraction and microarray analysis. A statistically significant gene list (P ≤ .01) was obtained using normalized expression values of the 5 donors, and ANOVA Unequal Variance (Welch) was used as the statistical test. Cytokine-stimulated samples were compared with the neutralized condition to obtain a list of genes with at least 1.7-fold difference. Hierarchical clustering of both conditions and entities (genes) is represented in the heat-maps of normalized expression values, both within divided (A) and undivided (B) populations. Individual donors are indicated as numbers under the dendrogram. The bracket in panel B indicates a cluster of IFN-α–stimulated genes. (C) Genes regulated by IL-12 (compared with neutralized) were hierarchically clustered based on their expression pattern within the divided and undivided populations.
Figure 5
Figure 5
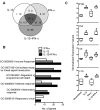
IL-12, but not IFN-α, regulates effector gene expression in human CD8+ T cells. (A) Differentially regulated genes by IL-12, IFN-α, and IL-12 + IFN-α were analyzed by Venn diagram to identify any genes commonly regulated by the different cytokine conditions. Individual segments are numbered corresponding to the gene list in supplemental Table 1. (B) Genes up-regulated by at least 1.7-fold were used to determine the Gene Ontology (GO) of the biological processes. The number of genes within a specific GO term is used as an indication of the magnitude of their functional correlation. (C) Normalized expression values of selected genes representing effector molecules are plotted as box-whisker bars (whiskers represent range).
Figure 6
Figure 6
CCR7loCXCR3hi sorted from healthy human peripheral blood show effector/effector memory gene expression pattern. (A) The heat-map represents the normalized expression values of CD8+CCR7hiCXCR3lo (R7hi) and CD8+CCR7loCXCR3hi (XR3hi) cells isolated from 4 individual healthy human donors (D6-D9) by FACS sorting. A statistically significant (P ≤ .01) gene list was obtained from the 2 subsets using a pair-wise t test. A list of differentially regulated genes (≥ 1.7-fold) in 4 donors was generated, and hierarchical clustering of both cell types and entities was performed. (B) Genes with higher expression values in CXCR3hi or CCR7hi cells (compared with each other) were used to determine Functional Annotation Clustering of Biological Processes using DAVID. Enrichment score of the cluster is used as an indication for how strongly groups of differentially expressed genes are involved within each functional cluster. (C) Normalized expression values of selected genes are plotted as box-whisker bars (whiskers represent range).
Figure 7
Figure 7
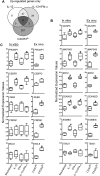
Effector memory CD8+ T cells isolated ex vivo and IL-12 programmed effector CD8+ T cells generated in vitro share a set of commonly regulated genes. Differentially expressed genes from the ex vivo samples were reassessed to identify genes expressed > 1.7-fold higher in all donors within the CXCR3hi compared with the CCR7hi cells. These genes were then assessed for commonality with the induced genes identified in cells activated with IL-12 and IL-12 + IFN-α culture conditions. (A) Genes up-regulated by either IL-12 or IL-12 + IFN-α and also increased in CD8+CCR7loCXCR3hi cells are shown in the Venn diagram. (B-C) Normalized expression values of selected genes are plotted as box-whisker bars (whiskers represent range).

References

    1. Sallusto F, Geginat J, Lanzavecchia A. Central memory and effector memory T cell subsets: function, generation, and maintenance. Annu Rev Immunol. 2004;22:745–763. - PubMed
    1. Wherry EJ, Teichgraber V, Becker TC, et al. Lineage relationship and protective immunity of memory CD8 T cell subsets. Nat Immunol. 2003;4(3):225–234. - PubMed
    1. Harrington LE, Janowski KM, Oliver JR, Zajac AJ, Weaver CT. Memory CD4 T cells emerge from effector T-cell progenitors. Nature. 2008;452(7185):356–360. - PubMed
    1. Butler NS, Harty JT. The role of inflammation in the generation and maintenance of memory T cells. Adv Exp Med Biol. 2010;684:42–56. - PubMed
    1. Mescher MF, Curtsinger JM, Agarwal P, et al. Signals required for programming effector and memory development by CD8+ T cells. Immunol Rev. 2006;211:81–92. - PubMed

Publication types