. 2011 Oct;8(5):055002.
doi: 10.1088/1478-3975/8/5/055002. Epub 2011 Aug 10.

Quantifying negative feedback regulation by micro-RNAs

Affiliations

Quantifying negative feedback regulation by micro-RNAs

Shangying Wang et al. Phys Biol. 2011 Oct.

Abstract

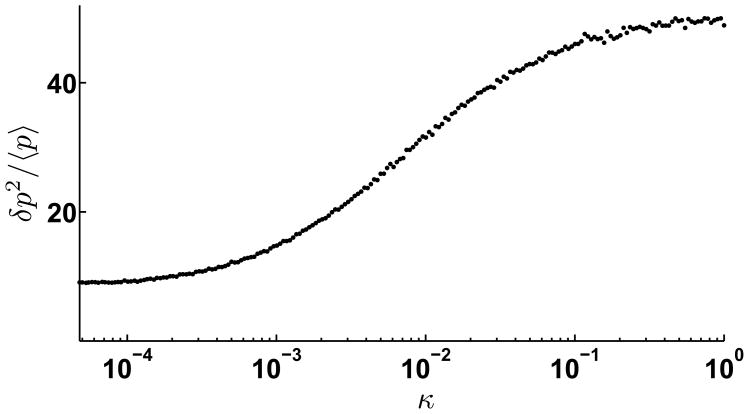
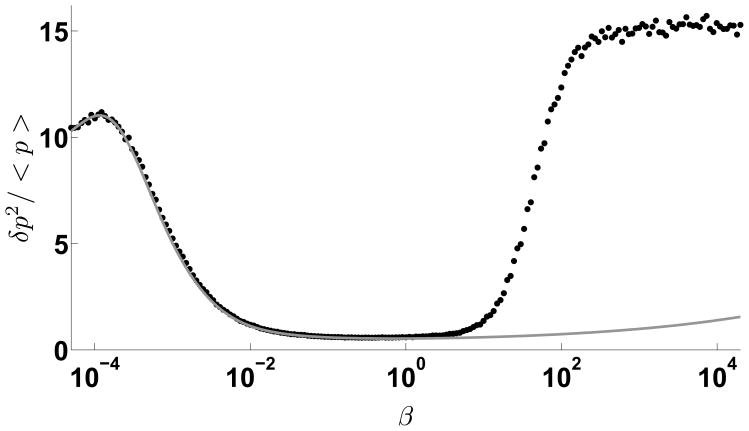
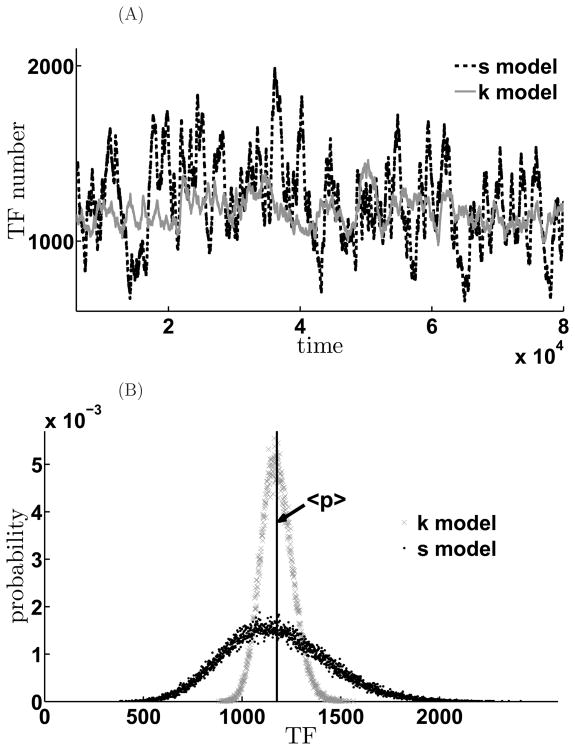
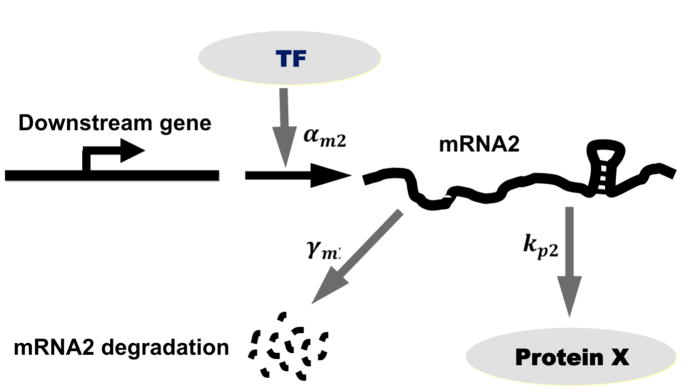
Micro-RNAs (miRNAs) play a crucial role in post-transcriptional gene regulation by pairing with target mRNAs to repress protein production. It has been shown that over one-third of human genes are targeted by miRNA. Although hundreds of miRNAs have been identified in mammalian genomes, the function of miRNA-based repression in the context of gene regulation networks still remains unclear. In this study, we explore the functional roles of feedback regulation by miRNAs. In a model where repression of translation occurs by sequestration of mRNA by miRNA, we find that miRNA and mRNA levels are anti-correlated, resulting in larger fluctuation in protein levels than theoretically expected assuming no correlation between miRNA and mRNA levels. If miRNA repression is due to a catalytic suppression of translation rates, we analytically show that the protein fluctuations can be strongly repressed with miRNA regulation. We also discuss how either of these modes may be relevant for cell function.


Figures

Figure 1
Figure 1
Schematic illustration of the miRNA-mediated negative feedback loop.
Figure 2
Figure 2. miRNA-based feedback introduces an expression threshold in sequestration model
The mean value of mRNA (A), miRNA (B) and protein (C) are shown as a function of αm for four different values of the peak miRNA transcriptional rate (σ). When σ is extremely small, m and p are proportional to αm because there is almost no miRNA synthesis. For larger σ, the miRNA-based feedback introduces a threshold at αmσ. All the asymptotic lines are parallel to each other. γm = γμ = 0.01, γp = 0.002, κ = 1.0, kp = 0.1 and kd = 200.0.
Figure 3
Figure 3. Increasing miRNA-mediated feedback strength sharpens the expression threshold
Mean protein numbers as a function of upstream transcription rate. The different curves show how threshold expression depends on the strength of miRNA/mRNA association rate. Mean protein expression shows a crossover regime from low expression to linear expression with increasing transcription rate. As the strength of miRNA/mRNA association, κ, increases, the threshold becomes sharper. The solid curve is a perfect threshold-linear behavior. The parameters are set as γm = γμ = 0.01, γp = 0.002, σ = 0.5, kp = 0.1, kd = 200.0.
Figure 4
Figure 4. miRNA and mRNA levels are anti-correlated
Temporal evolution of mRNA (black) and miRNA (gray) in a Monte-Carlo simulation of the sequestration model using the Gillespie algorithm. The parameters are set as αm = 1, γm = γμ = 0.01, γp = 0.001, κ = 1.0, σ = 1.0, kd = 200.0, kp = 0.1. The anti-correlation suggests that assuming 〈〉 = 〈m〉〈μ〉 is not valid.
Figure 5
Figure 5. Negative feedback amplifies expression noise in the sequestration model
(A)–(C). Fano factor of mRNA, miRNA and protein are plotted versus αm. Solid lines represent the simulation results and dashed lines represent the analytical calculation from the mean field model. The mean field model cannot be used to describe the system around the threshold, where the mRNA and miRNA levels are comparable. The solid straight line in (C) represents the asymptote for protein Fano factor value for large αm. (D). Histogram protein numbers at steady state for αm = 1.0: the mean values are 〈p〉 = 600, δp2p=43.2. The protein distribution shows a long tail, which suggests that while mean values may be kept low, protein numbers can exhibit large values across the population allowing the transcription factor to act at promoters with widely different sensitivities.
Figure 6
Figure 6. Expression variability increases with negative feedback strength
Fano factor of TF numbers is plotted versus the strength of bimolecular miRNA-mRNA association rate, κ for sequestration model. The transcription rate, αm = 1.2, at the cross-over point in Figure 3. Other parameters were set at γm = γμ = 0.01, γp = 0.001, σ = 1.0, kp = 0.1, kd = 100.0. For κ =0, there is no miRNA-mediated translational repression, and Fano factor is the lowest. The Fano factor increases with κ, until it reaches a saturating value.
Figure 7
Figure 7. Negative feedback in the catalytic suppression model shows reduced expression variability over a large range of feedback strength
The Fano factor of TF is plotted versus β for kinetic suppression model. The solid line is the analytical solution from the linear noise approximation method, dots represent results of Gillespie-algorithm simulation. Other parameters are set as: αm = 1.2, γm = γμ = 0.01, γp = 0.001, σ = 1.0, kp = 0.1, kd = 100.0. Although there is a temporary increase of the noise for low feedback strengths, it decreases very rapidly over a long range. For large values of β, linear noise approximation breaks down and single molecule effects dominate. Note that the variability is lower than in the sequestration model.
Figure 8
Figure 8. Negative feedback strength in the catalytic suppression model affects expression variability for different promoter strength
The relationship between the Fano factor of TF and β with four different values of αm. γm = γμ = 0.01, γp = 0.002, σ = 0.5, kp = 0.1, kd = 200.0.
Figure 9
Figure 9. Expression variability depends on the mode of translational repression by miRNA
Comparison of the different effects on the noise of the two negative feedback schemes. A. Time evolution of the mean TF values for sequestration (black curves) and kinetic suppression model (gray). B. Histogram of the steady state TF distribution for the sequestration model (black) and for the kinetic suppression model (gray). The parameters are αm = 1.1, γm = γμ = 0.01, γp = 0.001, σ = 1.0, kp = 0.1, kd = 100.0, κ = 1.0, β = 0.00087. κ and β are chosen so that their mean TF values are almost the same in both models. In the sequestration model, < p >= 1174.6, δp2p=57.34, However, in the kinetic suppression model, < p >= 1176.2, δp2p=5.41. Thus, in K model, both signal and noise are suppressed; while in S model, signal is suppressed, however, noise are amplified.
Figure 10
Figure 10
Scheme of transcriptional cascade involving the feedback-regulated TF and a downstream gene.
Figure 11
Figure 11. Scheme of information propagation in downstream gene
(A). Three different model genes with similar promoter strength (Hill coefficient n = 10.) but with different sensitivities. (B). The TF number histograms are plotted to display their overlap with the expression regions.
Figure 12
Figure 12. Mode of miRNA-mediated negative feedback can affect noise transmission to downstream genes in transcriptional cascades
Different noise level effect on downstream gene for different dissociation constants. When KD is small, the downstream gene of both models are triggered. The mean value of downstream proteins in the K model is larger than in the S model. However, while KD increases, although both mean values of downstream proteins decreases, The mean value of downstream proteins in the K model will be smaller than in the S model while KD is over some value because of the long tail noise of S model. (A) KD = 800, (B) KD = 1400, (C) KD = 1700. α = 1.1, γm = γμ = 0.01, γp = 0.001, kd = 100.0, kp = 0.1, κ = 1.0, β = 0.00087, σ = 1.0, ε = 0.1, γm2 = 0.01, kp2 = 0.1, γp2 = 0.001.

Similar articles

Cited by

References

    1. Bartel David P. Micrornas: genomics, biogenesis, mechanism, and function. Cell. 2004 Jan;116(2):281–297. - PubMed
    1. Lewis Benjamin P, Burge Christopher B, Bartel David P. Conserved seed pairing, often flanked by adenosines, indicates that thousands of human genes are microrna targets. Cell. 2005 Jan;120(1):15–20. - PubMed
    1. Tsang John, Zhu Jun, van Oudenaarden Alexander. Microrna-mediated feedback and feedforward loops are recurrent network motifs in mammals. Mol Cell. 2007 Jun;26(5):753–767. - PMC - PubMed
    1. Kim Jongpil, Inoue Keiichi, Ishii Jennifer, Vanti William B, Voronov Sergey V, Murchison Elizabeth, Hannon Gregory, Abeliovich Asa. A microrna feedback circuit in midbrain dopamine neurons. Science. 2007 Aug;317(5842):1220–1224. - PMC - PubMed
    1. Cohen Stephen M, Brennecke Julius, Stark Alexander. Denoising feedback loops by thresholding–a new role for micrornas. Genes Dev. 2006 Oct;20(20):2769–2772. - PubMed

Publication types

LinkOut - more resources